Exam 3: Statistics for Describing, Exploring, and Comparing Data
Exam 1: Introduction to Statistics106 Questions
Exam 2: Summarizing and Graphing Data85 Questions
Exam 3: Statistics for Describing, Exploring, and Comparing Data187 Questions
Exam 4: Probability186 Questions
Exam 5: Discrete Probability Distributions155 Questions
Exam 6: Normal Probability Distributions227 Questions
Exam 7: Estimates and Sample Size141 Questions
Exam 8: Hypothesis Testing139 Questions
Exam 9: Inferences From Two Samples133 Questions
Exam 10: Correlation and Regression104 Questions
Exam 11: Chi-Square and Analysis of Variance65 Questions
Select questions type
Find the standard deviation of the data summarized in the given frequency distribution.
-The test scores of 40 students are summarized in the frequency distribution below. Find the standard deviation. Score Students 50-59 6 60-69 6 70-79 5 80-89 6 90-99 17
(Multiple Choice)
4.9/5  (40)
(40)
Find the range for the given sample data.
-Jorge has his own business as a painter. The amounts he made in the last five months are shown below. \ 2401 \ 2496 \ 1419 \ 1913 \ 1266
(Multiple Choice)
4.9/5 (35)
Suppose that a state introduces a state income tax which will be at a flat rate of 3%. The state legislature wishes to estimate how much money they will receive in taxes, and to do this they need to know the average income of residents of the state. Which information would be most useful, the mean income, the median income, or the mode of the incomes? Why?
(Essay)
4.8/5 (33)
Find the mean for the given sample data. Unless indicated otherwise, round your answer to one more decimal place than is present in the original data values.
-The normal monthly precipitation (in inches) for August is listed for 20 different U.S. cities. Find the mean monthly precipitation. 3.5 1.6 2.4 3.7 4.1
3.9 1.0 3.6 4.2 3.4
3.7 2.2 1.5 4.2 3.4
2.7 0.4 3.7 2.0 3.6
(Multiple Choice)
4.9/5 (31)
If all the values in a data set are converted to z-scores, the shape of the distribution of the z-scores will be bell-shaped regardless of the distribution of the original data.
(True/False)
4.9/5 (32)
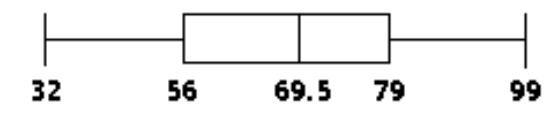
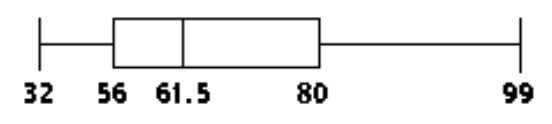
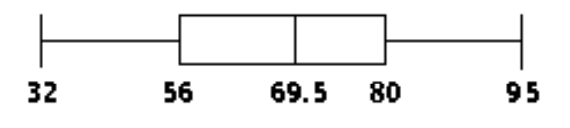
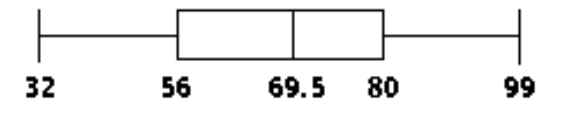
Construct a boxplot for the given data. Include values of the 5-number summary in all boxplots.
-The test scores of 32 students are listed below. Construct a boxplot for the data set.
32 37 41 44 46 48 53 55
57 57 59 63 65 66 68 69
70 71 74 74 75 77 78 79
81 82 83 86 89 92 95 99
A)
 B)
B)
 C)
C)
 D)
D)
(Short Answer)
4.9/5 (33)
A department store, on average, has daily sales of $28,567.95. The standard deviation of sales is $ 1000. On Tuesday, the store sold $35,492.00 worth of goods. Find Tuesday's z score. Was Tuesday an unusually good day?
(Multiple Choice)
4.8/5 (28)
Find the variance for the given data. Round your answer to one more decimal place than the original data.
-The normal monthly precipitation (in inches) for August is listed for 12 different U.S. cities.
3.5 1.6 2.4 3.7 4.1 3.9
1.0 3.6 4.2 3.4 3.7 2.2
A) in.
B) in.
C) in.
D)
(Short Answer)
4.7/5 (31)
The mean height of a basketball team is 6.3 feet with a standard deviation of 0.2 feet. The team's center is 7 feet tall. Find the center's z score. Is his score unusual?
(Multiple Choice)
4.9/5 (34)
Find the mean of the data summarized in the given frequency distribution.
-A company had 80 employees whose salaries are summarized in the frequency distribution below. Find the mean salary. Salary (\ ) Employees 5,001-10,000 13 10,001-15,000 15 15,001-20,000 19 20,001-25,000 14 25,001-30,000 19
(Multiple Choice)
4.8/5 (37)
Find the variance for the given data. Round your answer to one more decimal place than the original data.
-Jeanne is currently taking college zoology. The instructor often gives quizzes. On the past five quizzes, Jeanne got the following scores: 16 7 7 18 8
(Multiple Choice)
4.8/5 (39)
Find the mean for the given sample data. Unless indicated otherwise, round your answer to one more decimal place than is present in the original data values.
-Andrew asked seven of his friends how many cousins they had. The results are listed below. Find the mean number of cousins. 16 11 4 9 5 2 8
(Multiple Choice)
4.9/5 (28)
Dave is a college student contemplating a possible career option. One factor that will influence his decision is the amount of money he is likely to make. He decides to look up the average salary of graduates in that profession. Which information would be more useful to him, the mean salary or the median salary. Why?
(Essay)
4.8/5 (36)
Find the z-score corresponding to the given value and use the z-score to determine whether the value is unusual.
Consider a score to be unusual if its z-score is less than -2.00 or greater than 2.00. Round the z-score to the nearest tenth if necessary.
-A body temperature of 96.5° F given that human body temperatures have a mean of 98.20° F and a standard deviation of 0.62°.
(Multiple Choice)
4.8/5 (34)
The test scores of 40 students are listed below. Find P .
30 35 43 44 47 48 54 55 56 57
59 62 63 65 66 68 69 69 71 72
72 73 74 76 77 77 78 79 80 81
81 82 83 85 89 92 93 94 97 98
(Multiple Choice)
4.8/5 (46)
Find the variance for the given data. Round your answer to one more decimal place than the original data.
- -1 7 -11 7 8
(Multiple Choice)
4.8/5 (43)
Find the standard deviation for the given sample data. Round your answer to one more decimal place than is present in
the original data.
- 194 283 131 171 196 119 293 132 193
(Multiple Choice)
4.9/5 (31)
Find the standard deviation for the given sample data. Round your answer to one more decimal place than is present in the original data.
-Listed below are the amounts of weight change (in pounds) for 12 women during their first year of work after graduating from college. Positive values correspond to women who gained weight and negative values correspond to women who lost weight.
4 -8 14 10 -9 12 -6 1 0 4 -3 9
(Multiple Choice)
4.9/5 (34)
Explain how two data sets could have equal means and modes but still differ greatly. Give an example with two data sets to illustrate.
(Essay)
4.9/5 (24)
Filters
- Essay(0)
- Multiple Choice(0)
- Short Answer(0)
- True False(0)
- Matching(0)