Exam 3: Statistics for Describing, Exploring, and Comparing Data
Exam 1: Introduction to Statistics106 Questions
Exam 2: Summarizing and Graphing Data85 Questions
Exam 3: Statistics for Describing, Exploring, and Comparing Data187 Questions
Exam 4: Probability186 Questions
Exam 5: Discrete Probability Distributions155 Questions
Exam 6: Normal Probability Distributions227 Questions
Exam 7: Estimates and Sample Size141 Questions
Exam 8: Hypothesis Testing139 Questions
Exam 9: Inferences From Two Samples133 Questions
Exam 10: Correlation and Regression104 Questions
Exam 11: Chi-Square and Analysis of Variance65 Questions
Select questions type
Find the range for the given sample data.
-The amounts below represent the last twelve transactions made to Juan's checking account. Positive numbers represent deposits and negative numbers represent debits from his account. \ 28 -\ 20 \ 67 -\ 22 -\ 15 \ 17 -\ 47 \ 41 \ 53 -\ 13 \ 30 \ 81
(Multiple Choice)
4.8/5  (43)
(43)
When data are summarized in a frequency distribution, the median can be found by first identifying the median class (the class that contains the median). We then assume that the values in that class are evenly distributed and we can interpolate. This process can be described by where n is the sum of all class frequencies and m is the sum of the class frequencies that precede the median class. Use this procedure to find the median of the frequency distribution below:
Score Frequency 50-59 21 60-69 24 70-79 25 80-89 17 90-99 13
A) 71.6
B) 74.5
C) 71.8
D) 72.2
(Short Answer)
4.8/5 (34)
Find the mode(s) for the given sample data.
- 80 46 32 46 29 80
(Multiple Choice)
4.8/5 (30)
Skewness can be measured by Pearson's index of skewness:
If or , the data can be considered significantly skewed. Would you expect that incomes of all adults in the US would be skewed? In which direction? Why? Would you expect that for these incomes, Pearson's index of skewness would be greater than 1, smaller than , or between and 1 ?
(Essay)
4.8/5 (36)
Find the mode(s) for the given sample data.
- 20 36 46 36 49 36 49
(Multiple Choice)
4.8/5 (32)
We want to compare two different groups of students, students taking Composition 1 in a traditional lecture format and students taking Composition 1 in a distance learning format.
We know that the mean score on the research paper is 85 for both groups. What additional information would be provided by knowing the standard deviation?
(Essay)
4.9/5 (33)
In chemistry, the Kelvin scale is often used to measure temperatures. On the Kelvin scale, zero degrees is absolute zero. Temperatures on the Kelvin scale are related to temperatures on the Celsius scale as follows: . Temperatures on the Fahrenheit scale are related to temperatures on the Celsius scale as follows: .
A set of temperatures is given in Celsius, Kelvin, and Fahrenheit. How will the standard deviations of the three sets of data compare?
(Essay)
4.9/5 (42)
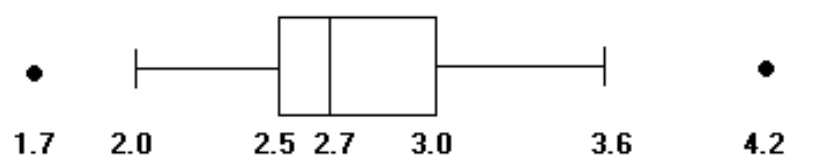
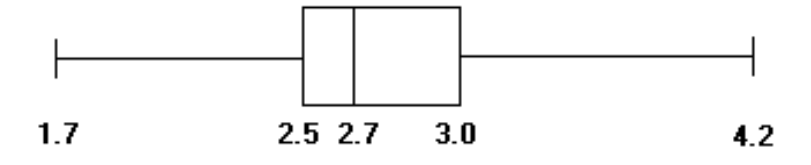
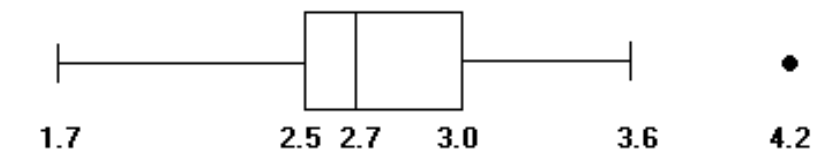
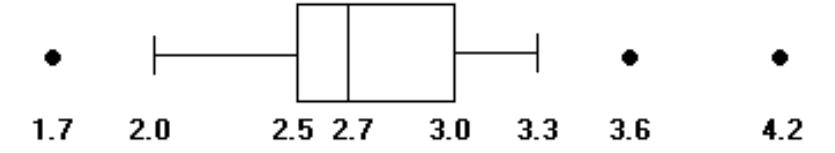
Construct a modified boxplot for the data. Identify any outliers.
-The weights (in ounces) of 27 tomatoes are listed below.
1.7 2.0 2.2 2.2 2.4 2.5 2.5 2.5 2.6
2.6 2.6 2.7 2.7 2.7 2.8 2.8 2.8 2.9
2.9 2.9 3.0 3.0 3.1 3.1 3.3 3.6 4.2
A) Outliers: 1.7 oz, 4.2 oz
 B) No outliers
 C) Outlier: 4.2 oz
 D) Outliers: 1.7 oz, 3.6 oz, 4.2 oz
(Short Answer)
4.9/5 (41)
The ages of the members of a gym have a mean of 48 years and a standard deviation of 10 years. What can you conclude from Chebyshev's theorem about the percentage of gym members aged between 26 and 70?
(Multiple Choice)
4.8/5 (44)
A store manager kept track of the number of newspapers sold each week over a seven-week period. The results are shown below. 79 13 215 140 300 242 230 Find the median number of newspapers sold.
(Multiple Choice)
4.7/5 (41)
Find the mean for the given sample data. Unless indicated otherwise, round your answer to one more decimal place than is present in the original data values.
-Listed below are the amounts of time (in months) that the employees of a restaurant have been working at the restaurant. Find the mean. 1 3 7 8 13 14 19 24 51 80 99 130 145 167
(Multiple Choice)
4.9/5 (34)
Find the variance for the given data. Round your answer to one more decimal place than the original data.
- 19 5 20 6 2
(Multiple Choice)
4.9/5 (41)
Use the empirical rule to solve the problem.
-The amount of Jen's monthly phone bill is normally distributed with a mean of $59 and a standard deviation of $8. What percentage of her phone bills are between $35 and $83?
(Multiple Choice)
4.8/5 (31)
Heights of adult women are known to have a bell-shaped distribution. Draw a boxplot to illustrate the results.
(Essay)
4.8/5 (41)
Find the z-score corresponding to the given value and use the z-score to determine whether the value is unusual.
Consider a score to be unusual if its z-score is less than -2.00 or greater than 2.00. Round the z-score to the nearest tenth if necessary.
-A test score of 50.2 on a test having a mean of 73 and a standard deviation of 12. A) ; unusual
B) ; not unusual
C) -1.9; unusual
D) ; not unusual
(Short Answer)
4.9/5 (32)
The harmonic mean is often used as a measure of center for data sets consisting of rates of change, such as speeds. It is found by dividing the number of values (n) by the sum of the reciprocals of all
Values, expressed as Pierre drives to work (a distance of 50 miles) at a speed of 67 mph and returns home at a speed of 46 mph. What is his average speed for the round trip? Use the harmonic mean.
(Multiple Choice)
4.9/5 (36)
When finding percentiles, if the locator L is not a whole number, one procedure is to interpolate so that a locator of 23.75, for example, leads to a value that is 3/4 of the way between the 23rd and 24th scores. Use this method of interpolation to find P75 for the set of test scores below. 51 54 64 68 72 74 78 83 91 94 99
(Multiple Choice)
4.7/5 (28)
Human body temperatures have a mean of 98.20° F and a standard deviation of 0.62°. Sally's temperature can be described by . What is her temperature? Round your answer to the nearest hundredth.
(Multiple Choice)
4.9/5 (45)
Find the mean for the given sample data. Unless indicated otherwise, round your answer to one more decimal place than is present in the original data values.
-The students in Hugh Logan's math class took the Scholastic Aptitude Test. Their math scores are shown below. Find the mean score. 588 563 357 341 526 344 346 644 470 482
(Multiple Choice)
4.8/5 (27)
Find the mean for the given sample data. Unless indicated otherwise, round your answer to one more decimal place than is present in the original data values.
-Six college buddies bought each other Christmas gifts. They amounts they spent are shown below. \ 273.79 \ 264.48 \ 180.50 \ 123.42 \ 188.27 \ 194.20 What was the mean amount spent? Round your answer to the nearest cent.
(Multiple Choice)
4.9/5 (33)
Filters
- Essay(0)
- Multiple Choice(0)
- Short Answer(0)
- True False(0)
- Matching(0)