Exam 3: Statistics for Describing, Exploring, and Comparing Data
Exam 1: Introduction to Statistics106 Questions
Exam 2: Summarizing and Graphing Data85 Questions
Exam 3: Statistics for Describing, Exploring, and Comparing Data187 Questions
Exam 4: Probability186 Questions
Exam 5: Discrete Probability Distributions155 Questions
Exam 6: Normal Probability Distributions227 Questions
Exam 7: Estimates and Sample Size141 Questions
Exam 8: Hypothesis Testing139 Questions
Exam 9: Inferences From Two Samples133 Questions
Exam 10: Correlation and Regression104 Questions
Exam 11: Chi-Square and Analysis of Variance65 Questions
Select questions type
Find the midrange for the given sample data.
- 49 52 52 52 74 67 55 55
(Multiple Choice)
4.9/5  (40)
(40)
Find the median for the given sample data.
-The weights (in ounces) of 21 cookies are shown. Find the median weight. 0.89 1.39 0.89 1.62 0.88 0.88 1.08 1.39 1.53 0.99 0.89 1.37 1.40 0.71 0.47 1.37 0.88 1.40 1.72 0.88 0.56
(Multiple Choice)
4.7/5 (33)
The heights of the adults in one town have a mean of 66.8 inches and a standard deviation of 3.4 inches. What can you conclude from Chebyshev's theorem about the percentage of adults in the town whose heights are between 60 and 73.6 inches?
(Multiple Choice)
4.8/5 (34)
Find the variance for the given data. Round your answer to one more decimal place than the original data.
- 17.5 13.5 16.9 14.5 16.1
(Multiple Choice)
4.8/5 (30)
Construct a boxplot for the given data. Include values of the 5-number summary in all boxplots.
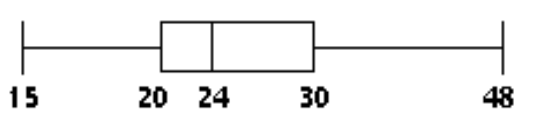
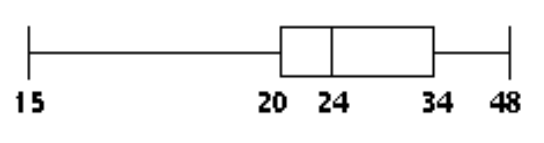
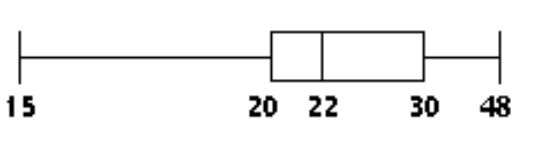
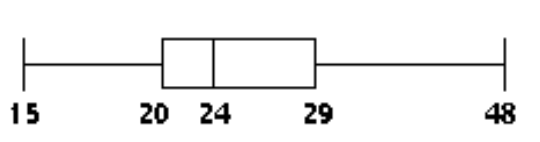
-The ages of the 35 members of a track and field team are listed below. Construct a boxplot for the data set.
15 16 18 18 18 19 20
20 20 21 21 22 22 23
23 24 24 24 25 25 26
27 27 28 29 29 30 31
31 33 34 35 39 42 48
A)
 B)
B)
 C)
C)
 D)
D)
(Short Answer)
4.8/5 (31)
Determine which score corresponds to the higher relative position.
-Which is better: a score of 82 on a test with a mean of 70 and a standard deviation of 8, or a score of 82 on a test with a mean of 75 and a standard deviation of 4?
(Multiple Choice)
5.0/5 (33)
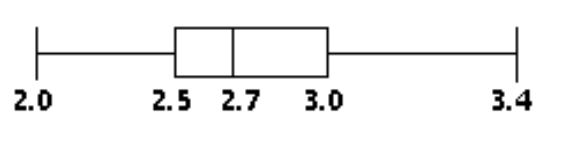
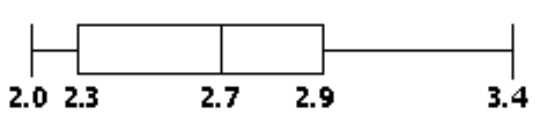
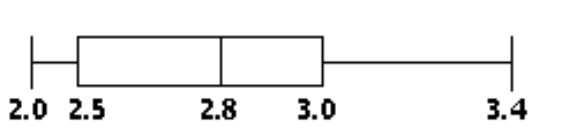
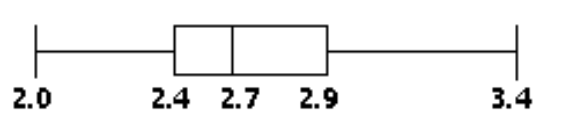
Construct a boxplot for the given data. Include values of the 5-number summary in all boxplots.
-The weights (in ounces) of 27 tomatoes are shown below. Construct a boxplot for the data set.
2.0 2.1 2.2 2.2 2.4 2.4 2.5 2.5 2.5
2.6 2.6 2.7 2.7 2.7 2.7 2.8 2.8 2.8
2.9 2.9 3.0 3.0 3.0 3.1 3.1 3.2 3.4
A)
 B)
B)
 C)
C)
 D)
D)
(Short Answer)
4.9/5 (30)
Responses to a survey question about eye color are coded as 1 (for brown), 2 (for blue), 3 (for green), 4 (for hazel), and 5 (for any other color). Does it make sense to find the mean, median, or mode of the coded eye colors?
(Essay)
4.8/5 (29)
Boxplots are graphs that are useful for revealing central tendency, the spread of the data, the distribution of the data and the presence of outliers. Draw an example of a box plot and comment on each of these characteristics as shown by your boxplot.
(Essay)
4.8/5 (34)
Listed below are the amounts of time (in months) that the employees of an electronics company have been working at the company. Find the midrange. 15 21 27 34 49 55 61 66 75 75 85 93 132 150
(Multiple Choice)
4.9/5 (36)
The mean of a set of data is 374.92 and its standard deviation is 105.19. Find the z score for a value of 327.83.
(Multiple Choice)
4.8/5 (25)
A student earned grades of C, A, B, and A. Those courses had these corresponding numbers of credit hours: , and 6 . The grading system assigns quality points to letter grades as follows: , and . Compute the grade point average (GPA) and round the result to two decimal places.
(Multiple Choice)
4.8/5 (30)
A student earned grades of B, B, A, C, and D. Those courses had these corresponding numbers of credit hours: 4, 5, 2, 5, 4. The grading system assigns quality points to letter grades as follows:
A = 4, B = 3, C = 2, D = 1, and F = 0. Compute the grade point average (GPA) and round the result to two decimal places.
(Multiple Choice)
4.8/5 (40)
Find the midrange for the given sample data.
-Bill kept track of the number of hours he spent exercising each week. The results for 15 weeks are shown below. Find the midrange.
7.4 6.7 7.4 7.4 7.6 8.0 6.6 8.0 8.4 7.4 8.8 6.7 8.0 9.0 7.6
(Multiple Choice)
4.9/5 (40)
Find the median for the given sample data.
-The ages (in years) of the eight passengers on a bus are listed below. 6 1 26 15 23 40 32 32 Find the median age.
(Multiple Choice)
4.9/5 (39)
Find the number of standard deviations from the mean. Round your answer to two decimal places.
-Mario's weekly poker winnings have a mean of $323 and a standard deviation of $50. Last week he won $177. How many standard deviations from the mean is that?
(Multiple Choice)
4.8/5 (32)
Find the range for the given sample data.
-Fred, a local mechanic, recorded the price of an oil and filter change at twelve competing service stations. The prices (in dollars) are shown below. 32.99 24.95 26.95 28.95 18.95 28.99 30.95 22.95 24.95 26.95 29.95 28.95
(Multiple Choice)
4.9/5 (26)
Suppose that all the values in a data set are converted to z-scores. Which of the statements below is true?
A: The mean of the z-scores will be zero, and the standard deviation of the z-scores will be the same as the standard deviation of the original data values.
B: The mean and standard deviation of the z-scores will be the same as the mean and standard deviation of the original data values.
C: The mean of the z-scores will be 0, and the standard deviation of the z-scores will be 1.
D: The mean and the standard deviation of the z-scores will both be zero.
(Multiple Choice)
4.8/5 (30)
Determine which score corresponds to the higher relative position.
-Which score has a higher relative position, a score of on a test for which and s , or a score of 276 on a test for which and s ?
A) A score of
B) Both scores have the same relative position.
C) A score of 276
(Short Answer)
4.7/5 (44)
Find the number of standard deviations from the mean. Round your answer to two decimal places.
-The annual snowfall in a town has a mean of 39 inches and a standard deviation of 10 inches. Last year there were 64 inches of snow. How many standard deviations from the mean is that?
(Multiple Choice)
4.7/5 (34)
Filters
- Essay(0)
- Multiple Choice(0)
- Short Answer(0)
- True False(0)
- Matching(0)