Exam 3: Statistics for Describing, Exploring, and Comparing Data
Exam 1: Introduction to Statistics106 Questions
Exam 2: Summarizing and Graphing Data85 Questions
Exam 3: Statistics for Describing, Exploring, and Comparing Data187 Questions
Exam 4: Probability186 Questions
Exam 5: Discrete Probability Distributions155 Questions
Exam 6: Normal Probability Distributions227 Questions
Exam 7: Estimates and Sample Size141 Questions
Exam 8: Hypothesis Testing139 Questions
Exam 9: Inferences From Two Samples133 Questions
Exam 10: Correlation and Regression104 Questions
Exam 11: Chi-Square and Analysis of Variance65 Questions
Select questions type
Without calculating the standard deviation, compare the standard deviation for the following three data sets. (Note: All data sets have a mean of 30.) Which do you expect to have the largest standard deviation and which do you expect to have the smallest standard deviation? Explain your answers in terms of the formula s .
Set A: 30 30 30 30 30 30 30 30 30 30 Set B: 20 25 25 30 30 30 30 35 35 40 Set C: 20 20 20 25 25 35 35 40 40 40
(Essay)
4.8/5  (31)
(31)
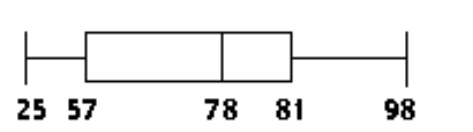
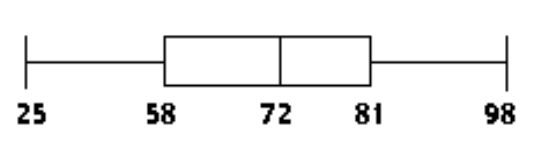
Describe any similarities or differences in the two distributions represented by the following boxplots. Assume the two boxplots have the same scale.

(Not Answered)
This question doesn't have any answer yet
Find the coefficient of variation for each of the two sets of data, then compare the variation. Round results to one decimal place.
-The customer service department of a phone company is experimenting with two different systems. On Monday they try the first system which is based on an automated menu system. On Tuesday they try the second system in which each caller is immediately connected with a live agent. A quality control manager selects a sample of seven calls each day. He records the time for each
Customer to have his or her question answered. The times (in minutes) are listed below.
Automated Menu: 11.1 7.4 3.8 2.9 9.2 6.3 5.5 Live agent: 6.6 2.7 4.1 4.1 3.4 5.2 3.7
(Multiple Choice)
4.7/5 (33)
If the standard deviation of a set of data is zero, what can you conclude about the set of values?
(Multiple Choice)
4.9/5 (35)
Which score has the highest relative position: a score of 46 on a test for which and s , a score of on a test for which and or a score of on a test for which and
(Multiple Choice)
4.8/5 (37)
Michael gets test grades of 73, 79, 80, and 85. He gets a 83 on her final exam. Find the weighted mean if the tests each count for 15% and the final exam counts for 40% of the final grade. Round to one decimal place.
(Multiple Choice)
4.9/5 (27)
Find the standard deviation for the given sample data. Round your answer to one more decimal place than is present in the original data.
-Christine is currently taking college astronomy. The instructor often gives quizzes. On the past seven quizzes, Christine got the following scores: 40 20 31 21 12 55 75
(Multiple Choice)
4.9/5 (36)
The empirical rule and Chebyshev's theorem are two concepts that are helpful in understanding or interpreting the value of a standard deviation. Both concepts relate a percentage of all data values to the number of standard deviations that lie within the mean.
What is the significant difference between the two concepts?
(Essay)
4.8/5 (32)
Describe any similarities or differences in the two distributions represented by the following boxplots. Assume the two boxplots have the same scale. 
(Not Answered)
This question doesn't have any answer yet
Rich Borne teaches Chemistry 101. Last week he gave his students a quiz. Their scores are listed below. 26 31 47 29 37 20 43 41 50 55 37 22
(Multiple Choice)
4.8/5 (35)
Find the mode(s) for the given sample data.
- 7.14 7.41 7.56 7.14 7.88 7.99 7.62
(Multiple Choice)
4.8/5 (34)
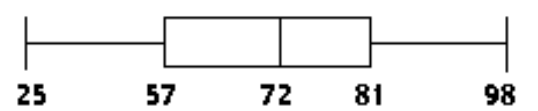
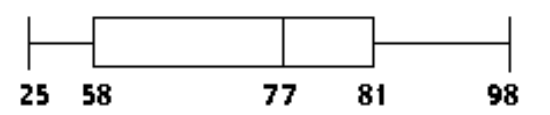
Construct a boxplot for the given data. Include values of the 5-number summary in all boxplots.
-The test scores of 40 students are listed below. Construct a boxplot for the data set.
25 35 43 44 47 48 54 55 56 57 59 62 63 65 66 68 69 69 71 72 72 73 74 76 77 77 78 79 80 81 81 82 83 85 89 92 93 94 97 98
A)
 B)
B)
 C)
C)
 D)
D)
(Short Answer)
4.9/5 (30)
For data which are heavily skewed to the right, P10 is likely to be closer to the median than P90.
(True/False)
4.8/5 (39)
Find the mean and median for each of the two samples, then compare the two sets of results.
-A comparison is made between summer electric bills of those who have central air and those who have window units.
May June July Aug Sept Central \ 32 \ 64 \ 80 \ 90 \ 65 Window \ 15 \ 84 \ 99 \ 120 \ 40
(Essay)
4.9/5 (34)
Jeremy called eight appliance stores and asked the price of a specific model of microwave oven. The prices quoted are listed below:
\ 115 \ 548 \ 222 \ 580 \ 359 \ 285 \ 317 \ 492
(Multiple Choice)
4.8/5 (28)
The mean of a set of data is 3.78 and its standard deviation is 4.08. Find the z score for a value of 13.70.
(Multiple Choice)
4.7/5 (35)
Find the standard deviation for the given sample data. Round your answer to one more decimal place than is present in the original data.
-The top nine scores on the organic chemistry midterm are as follows.
(Multiple Choice)
4.8/5 (42)
Determine which score corresponds to the higher relative position.
-Which score has a higher relative position, a score of 58 on a test for which and s , or a score of 399 on a test for which and s
(Multiple Choice)
4.8/5 (29)
Provide an appropriate response.
-If all the values in a data set are converted to z-scores, the shape of the distribution of the z-scores will be the same as the distribution of the original data.
(True/False)
4.8/5 (34)
Find the number of standard deviations from the mean. Round your answer to two decimal places.
-The number of hours per day a college student spends on homework has a mean of 4 hours and a standard deviation of 0.75 hours. Yesterday she spent 3 hours on homework. How many standard deviations from the mean is that?
(Multiple Choice)
5.0/5 (39)
Filters
- Essay(0)
- Multiple Choice(0)
- Short Answer(0)
- True False(0)
- Matching(0)