Exam 3: Statistics for Describing, Exploring, and Comparing Data
Exam 1: Introduction to Statistics106 Questions
Exam 2: Summarizing and Graphing Data85 Questions
Exam 3: Statistics for Describing, Exploring, and Comparing Data187 Questions
Exam 4: Probability186 Questions
Exam 5: Discrete Probability Distributions155 Questions
Exam 6: Normal Probability Distributions227 Questions
Exam 7: Estimates and Sample Size141 Questions
Exam 8: Hypothesis Testing139 Questions
Exam 9: Inferences From Two Samples133 Questions
Exam 10: Correlation and Regression104 Questions
Exam 11: Chi-Square and Analysis of Variance65 Questions
Select questions type
Find the mean for the given sample data. Unless indicated otherwise, round your answer to one more decimal place than is present in the original data values.
-Listed below are the amounts of weight change (in pounds) for 12 women during their first year of work after graduating from college. Positive values correspond to women who gained weight and negative values correspond to women who lost weight. What is the mean weight change?
1 -10 1 -9 17 -5 12 0 16 -4 18 7
(Multiple Choice)
4.8/5  (36)
(36)
Find the mode(s) for the given sample data.
-The speeds (in mi/h) of the cars passing a certain checkpoint are measured by radar. The results are shown below. 42.7 41.4 44.9 41.5 46.0 46.0 41.4 40.6 47.9 41.5 42.7 40.6 41.5 39.8 41.4 44.3 44.3 44.9 49.5 42.7
(Multiple Choice)
5.0/5 (26)
Which of the following statements regarding percentiles is true? (More than one statement may be true).
A: In any data set, is greater than
B: In any data set, is equal to
C: In a set of 20 test scores, the percentile of the second highest score is 95
(Multiple Choice)
4.8/5 (41)
Find the mean for the given sample data. Unless indicated otherwise, round your answer to one more decimal place than is present in the original data values.
-The weights (in pounds) of six dogs are listed below. Find the mean weight. 39 30 91 15 133 88
(Multiple Choice)
4.7/5 (33)
Find the indicated measure.
-The weights (in pounds) of 30 newborn babies are listed below. Find P16. 5.5 5.7 5.8 5.9 6.1 6.1 6.4 6.4 6.5 6.6 6.7 6.7 6.7 6.9 7.0 7.0 7.0 7.1 7.2 7.2 7.4 7.5 7.7 7.7 7.8 8.0 8.1 8.1 8.3 8.7
(Multiple Choice)
4.8/5 (33)
Listed below are the amounts of weight change (in pounds) for 12 women during their first year of work after graduating from college. Positive values correspond to women who gained weight and negative values correspond to women who lost weight. What is the midrange? 1 -6 2 -15 15 -7 8 0 25 -8 11 7
(Multiple Choice)
4.8/5 (38)
The normal monthly precipitation (in inches) for August is listed for 20 different U.S. cities. Find the median of the data. 3.5 1.6 2.4 3.7 4.1 3.9 1.0 3.6 4.2 3.4 3.7 2.2 1.5 4.2 3.4 2.7 0.4 3.7 2.0 3.6
(Multiple Choice)
4.8/5 (25)
Use the range rule of thumb to estimate the standard deviation. Round results to the nearest tenth.
-The heights in feet of people who work in an office are as follows. 5.9 5.5 5.8 5.4 5.6 5.7 5.9 6.2 5.8 5.7
(Multiple Choice)
4.9/5 (32)
Find the median for the given sample data.
-Listed below are the amounts of time (in months) that the employees of a restaurant have been working at the restaurant. Find the median. 12 3 7 8.5 12 15 19 47 51 77 99 124 142 167
(Multiple Choice)
4.8/5 (32)
Listed below are the amounts of weight change (in pounds) for 12 women during their first year of work after graduating from college. Positive values correspond to women who gained weight and negative values correspond to women who lost weight. What is the median weight change?
3 -12 1 -13 7 -1 6 0 8 -5 16 7
(Multiple Choice)
4.7/5 (29)
Find the number of standard deviations from the mean. Round your answer to two decimal places.
-In one town, the number of pounds of sugar consumed per person per year has a mean of 8 pounds and a standard deviation of 1.6 pounds. Tyler consumed 12 pounds of sugar last year. How many standard deviations from the mean is that?
(Multiple Choice)
4.8/5 (35)
Find the coefficient of variation for each of the two sets of data, then compare the variation. Round results to one decimal place.
-Listed below are the systolic blood pressures (in ) for a sample of men aged 20-29 and for a sample of men aged 60-69.
Men aged 20-29: 117 125 133 118 131 123 Men aged 60-69: 130 151 138 125 164 139
A) Men aged 20-29: 5.5%
Men aged 60-69: 10.5%
There is substantially more variation in blood pressures of the men aged 60-69.
B) Men aged 20-29:
Men aged 60-69: 4.6%
There is more variation in blood pressures of the men aged 20-29.
C) Men aged 20-29: 5.3%
Men aged 60-69:
There is substantially more variation in blood pressures of the men aged 60-69.
D) Men aged 20-29: 5.0%
Men aged 60-69: 8.2%
There is substantially more variation in blood pressures of the men aged .
(Short Answer)
4.7/5 (32)
Find the midrange for the given sample data.
-The weights (in ounces) of 18 cookies are shown. Find the midrange. 0.65 1.33 0.93 1.06 0.78 1.41 1.33 1.18 0.65 1.49 1.37 1.09 1.37 1.49 0.78 1.37 1.06 0.93
(Multiple Choice)
4.9/5 (36)
Listed below are the amounts of weight change (in pounds) for ten women during their first year of work after graduating from college. Positive values correspond to women who gained weight and negative values correspond to women who lost weight. What is the range?
3 9 5 12 -1 25 0 -4 7 -1
(Multiple Choice)
4.8/5 (28)
Find the standard deviation for the given sample data. Round your answer to one more decimal place than is present in the original data.
-The numbers listed below represent the amount of precipitation (in inches) last year in six different U.S. cities. 20.7 21.9 46.2 35.9 17.4 24.5
(Multiple Choice)
4.9/5 (32)
Describe how to find the percentile for a given score in a set of data. How does this process relate to the definition of a percentile score?
(Essay)
4.9/5 (30)
The two most frequently used measures of central tendency are the mean and the median.
Compare these two measures for the following characteristics: Takes every score into account? Affected by extreme scores? Advantages.
(Essay)
4.8/5 (40)
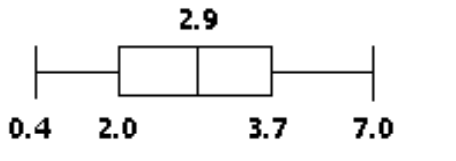
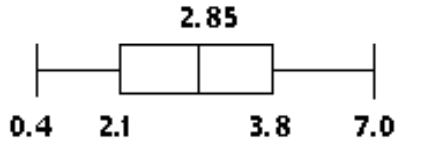
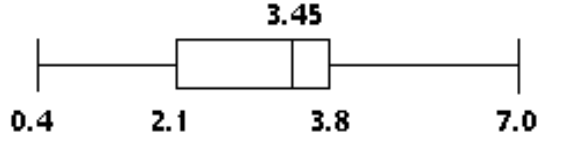
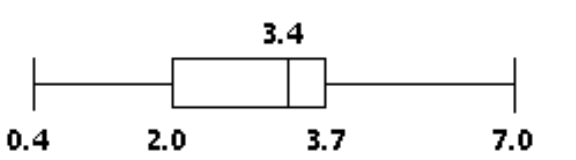
Construct a boxplot for the given data. Include values of the 5-number summary in all boxplots.
-The normal monthly precipitation (in inches) for August is listed for 20 different U.S. cities. Construct a boxplot for the data set.
0.4 1.0 1.5 1.6 2.0
2.2 2.4 2.7 3.4 3.4
3.5 3.6 3.6 3.7 3.7
A)
 B)
B)
 C)
C)
 D)
D)
(Short Answer)
4.8/5 (39)
Find the mode(s) for the given sample data.
- 78 25 78 13 25 29 56 78
(Multiple Choice)
4.7/5 (35)
The test scores of 40 students are listed below. Find .
30 35 43 44 47 48 54 55 56 57
59 62 63 65 66 68 69 69 71 72
72 73 74 76 77 77 78 79 80 81
81 82 83 85 89 92 93 94 97 98
(Multiple Choice)
4.9/5 (33)
Filters
- Essay(0)
- Multiple Choice(0)
- Short Answer(0)
- True False(0)
- Matching(0)