Exam 3: Statistics for Describing, Exploring, and Comparing Data
Exam 1: Introduction to Statistics106 Questions
Exam 2: Summarizing and Graphing Data85 Questions
Exam 3: Statistics for Describing, Exploring, and Comparing Data187 Questions
Exam 4: Probability186 Questions
Exam 5: Discrete Probability Distributions155 Questions
Exam 6: Normal Probability Distributions227 Questions
Exam 7: Estimates and Sample Size141 Questions
Exam 8: Hypothesis Testing139 Questions
Exam 9: Inferences From Two Samples133 Questions
Exam 10: Correlation and Regression104 Questions
Exam 11: Chi-Square and Analysis of Variance65 Questions
Select questions type
Find the variance for the given data. Round your answer to one more decimal place than the original data.
-A class of sixth grade students kept accurate records on the amount of time they spent playing video games during a one-week period. The times (in hours) are listed below: 11.7 17.9 18.4 12.9 17.1 15.8 11.3 28.7 18.0 26.4
A)
B)
C)
D)
(Short Answer)
4.9/5  (30)
(30)
Find the midrange for the given sample data.
- 3 6 9 0 4 1 11 5 9 14 3 8 2 15 0 9
(Multiple Choice)
4.9/5 (23)
The data below consists of the heights (in inches) of 20 randomly selected women. Find the 10% trimmed mean of the data set. The 10% trimmed mean is found by arranging the data in order, deleting the bottom 10% of the values and the top 10% of the values and then calculating the mean of the remaining values.
65 65 63 61 63 67 70 67 62 63 61 66 75 67 60 59 64 68 65 71
(Multiple Choice)
4.8/5 (37)
Explain how two data sets could have equal means and modes but still differ greatly. Give an example with two data sets to illustrate.
(Essay)
4.9/5 (33)
Find the mode(s) for the given sample data.
-Last year, nine employees of an electronics company retired. Their ages at retirement are listed below.
54 63 67 50 57 61 62 58 51
A) no mode
B)
C) 54 yr, 63 yr, 67 yr, 50 yr, 57 yr, 61 yr, 62 yr, 58 yr, 51 yr
D)
(Short Answer)
4.9/5 (40)
In a data set containing n values, the 67th percentile can be found as follows: ?
(True/False)
4.7/5 (26)
Find the range for the given sample data.
-A class of sixth grade students kept accurate records on the amount of time they spent playing video games during a one-week period. The times (in hours) are listed below:
19.9 15.4 8.3 19.9 25.2 28.9 20.7 24.2 16.5 22.9
(Multiple Choice)
4.9/5 (34)
Find the percentile for the data value.
-Data set:
data value: 51
(Multiple Choice)
4.8/5 (34)
Find the mean of the data summarized in the given frequency distribution.
-The manager of a bank recorded the amount of time each customer spent waiting in line during peak business hours one Monday. The frequency distribution below summarizes the results. Find the mean waiting time. Round your answer to one decimal place.
Waiting time (minutes) Number of customers 0-3 14 4-7 13 8-11 14 12-15 8 16-19 6 20-23 3 24-27 3
(Multiple Choice)
4.8/5 (33)
Find the standard deviation for the given sample data. Round your answer to one more decimal place than is present in the original data.
-Listed below are the amounts of time (in months) that the employees of a restaurant have been working at the restaurant.
2 3 5 12 23 31 69 86 101 122
(Multiple Choice)
4.9/5 (31)
The geometric mean is often used in business and economics for finding average rates of change, average rates of growth, or average ratios. Given n values (all positive), the geometric mean is the nth root of their product. The average growth factor for money compounded at annual interest rates of 30%, 12%, 20%, and 23% can be found by computing the geometric mean of 1.3, 1.12, 1.2, and 1.23. Find that average growth factor.
(Multiple Choice)
4.9/5 (41)
Find the range for the given sample data.
-The manager of an electrical supply store measured the diameters of the rolls of wire in the inventory. The diameters of the rolls (in meters) are listed below.
(Multiple Choice)
4.8/5 (35)
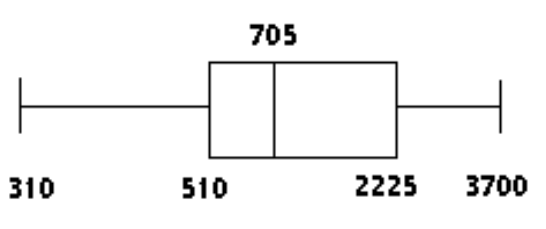
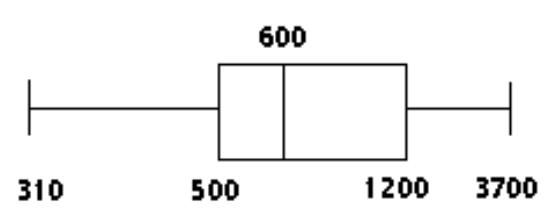
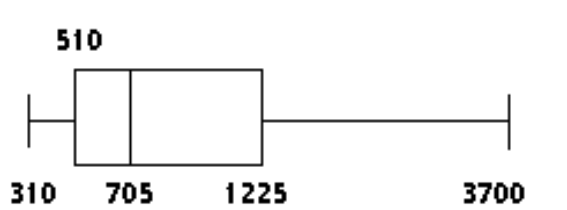
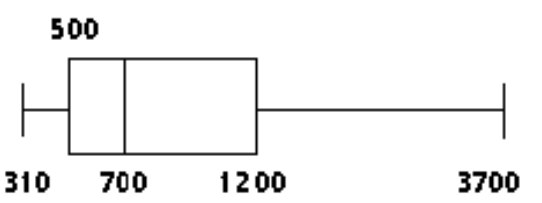
Construct a boxplot for the given data. Include values of the 5-number summary in all boxplots.
-The weekly salaries (in dollars) of 24 randomly selected employees of a company are shown below. Construct a boxplot for the data set.
310 320 450 460 470 500 520 540
580 600 650 700 710 840 870 900
1000 1200 1250 1300 1400 1720 2500 3700
A)
 B)
B)
 C)
C)
 D)
D)
(Short Answer)
4.9/5 (27)
Find the mean for the given sample data. Unless indicated otherwise, round your answer to one more decimal place than is present in the original data values.
-The amount of time (in hours) that Sam studied for an exam on each of the last five days is given below. Find the mean study time.
1.1 6.1 6.8 1.5 4.1
(Multiple Choice)
4.8/5 (43)
Find the range for the given sample data.
-The prices (in dollars) of 12 electric smoothtop ranges are listed below. 825 930 615 525 1425 1030 630 725 740 1230 515 1025
(Multiple Choice)
4.8/5 (33)
The weights (in ounces) of 14 different apples are shown below. 5.7 5.5 4.7 4.4 6.8 5.7 5.5 6.9 6.0 4.4 5.7 6.9 4.4 4.6
(Multiple Choice)
4.9/5 (28)
The test scores of 32 students are listed below. Find . 32 37 41 44 46 48 53 55 56 57 59 63 65 66 68 69 70 71 74 74 75 77 78 79 80 82 83 86 89 92 95 99
(Multiple Choice)
4.8/5 (36)
The median of a data set is always/sometimes/never (select one) one of the data points in a set of data. Explain your answer with brief examples.
(Essay)
4.9/5 (27)
The mean salary of the female employees of one company is $29,525. The mean salary of the male employees of the same company is $33,470. Can the mean salary of all employees of the company be obtained by finding the mean of $29,525 and $33,470? Explain your thinking. Under what conditions would the mean of $29,525 and $33,470 yield the mean salary of all employees of the company?
(Essay)
4.8/5 (36)
Find the z-score corresponding to the given value and use the z-score to determine whether the value is unusual.
Consider a score to be unusual if its z-score is less than -2.00 or greater than 2.00. Round the z-score to the nearest tenth if necessary.
-A weight of 110 pounds among a population having a mean weight of 161 pounds and a standard deviation of 24.3 pounds. A) -2.1; unusual
B) ; not unusual
C) ; unusual
D) -2.1; not unusual
(Short Answer)
4.8/5 (36)
Filters
- Essay(0)
- Multiple Choice(0)
- Short Answer(0)
- True False(0)
- Matching(0)