Exam 3: Statistics for Describing, Exploring, and Comparing Data
Exam 1: Introduction to Statistics106 Questions
Exam 2: Summarizing and Graphing Data85 Questions
Exam 3: Statistics for Describing, Exploring, and Comparing Data187 Questions
Exam 4: Probability186 Questions
Exam 5: Discrete Probability Distributions155 Questions
Exam 6: Normal Probability Distributions227 Questions
Exam 7: Estimates and Sample Size141 Questions
Exam 8: Hypothesis Testing139 Questions
Exam 9: Inferences From Two Samples133 Questions
Exam 10: Correlation and Regression104 Questions
Exam 11: Chi-Square and Analysis of Variance65 Questions
Select questions type
Find the standard deviation of the data summarized in the given frequency distribution.
-The manager of a bank recorded the amount of time each customer spent waiting in line during peak business hours one Monday. The frequency distribution below summarizes the results. Find the standard deviation. Round your answer to one decimal place.
Waiting time (minutes) Number of customer 0-3 15 4-7 10 8-11 9 12-15 14 16-19 0 20-23 2
(Multiple Choice)
4.8/5  (38)
(38)
Find the range for the given sample data.
-The owner of a small manufacturing plant employs six people. As part of their personnel file, she asked each employee to record the distance they travel one way from home to work. The six distances (in miles) are listed below: 2.8 5.3 1.4 4.8 6.6 3.3
(Multiple Choice)
4.7/5 (35)
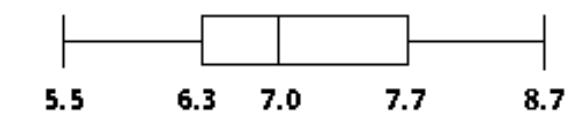
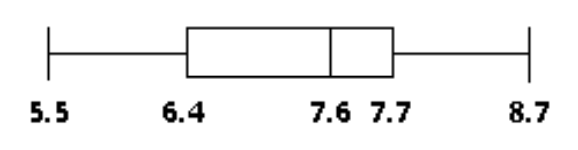
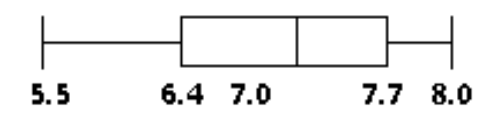
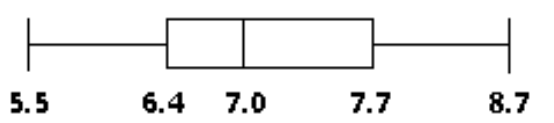
Construct a boxplot for the given data. Include values of the 5-number summary in all boxplots.
-The weights (in pounds) of 30 newborn babies are listed below. Construct a boxplot for the data set.
5.5 5.7 5.8 5.9 6.1 6.1 6.3 6.4 6.5 6.6
6.7 6.7 6.7 6.9 7.0 7.0 7.0 7.1 7.2 7.2
7.4 7.5 7.7 7.7 7.8 8.0 8.1 8.1 8.3 8.7
A)
 B)
B)
 C)
C)
 D)
D)
(Short Answer)
4.9/5 (34)
For any data set of n values with standard deviation s, every value must be within of the mean. In a class of 17 students, the heights of the students have a mean of 67.3 inches and a standard deviation of 3.2 inches. The tallest student in class, a hopeful member of the basketball team, claims to be
79.3 inches tall. Could he be telling the truth?
(Multiple Choice)
4.8/5 (27)
The data set below consists of the scores of 15 students on a quiz. For this data set, which measure of variation do you think is more appropriate, the range or the standard deviation? Explain your thinking.
90 90 91 91 89 90 89 91 91 90 60 90 89 90 91
(Essay)
4.8/5 (21)
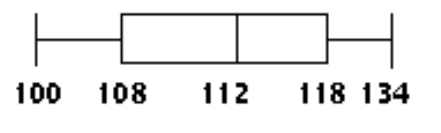
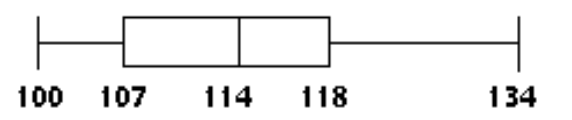
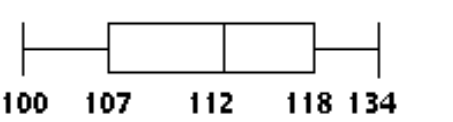
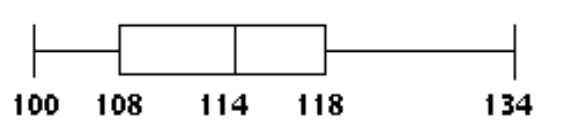
Construct a boxplot for the given data. Include values of the 5-number summary in all boxplots.
-The highest temperatures ever recorded (in °F) in 32 different U.S. states are shown below. Construct a boxplot for the data set.
100 100 105 105 106 106 107 107 109 110 110 112 112 112 114 114 114 115 116 117 118 118 118 118 118 119 120 121 122 125 128 134
A)
 B)
B)
 C)
C)
 D)
D)
(Short Answer)
4.9/5 (28)
Find the coefficient of variation for each of the two sets of data, then compare the variation. Round results to one decimal place.
-Compare the variation in heights to the variation in weights of thirteen-year old girls. The heights (in inches) and weights (in pounds) of nine randomly selected thirteen-year old girls are listed below.
Heights (inches): 59.4 61.2 62.1 64.7 60.1 58.3 64.6 63.7 66.1 Weights (pounds): 87 94 93 119 96 90 123 98 139
(Multiple Choice)
4.8/5 (32)
Find the mean of the data summarized in the given frequency distribution.
-The heights of a group of professional basketball players are summarized in the frequency distribution below. Find the mean height. Round your answer to one decimal place.
Height (in.) Frequency 70-71 3 72-73 5 74-75 15 76-77 8 78-79 15 80-81 5 82-83 3
(Multiple Choice)
4.7/5 (31)
A student earned grades of , and . Those courses had these corresponding numbers of credit hours: . The grading system assigns quality points to letter grades as follows: , and . Compute the grade point average (GPA) and round the result to two decimal places.
(Multiple Choice)
4.8/5 (41)
Find the mean for the given sample data. Unless indicated otherwise, round your answer to one more decimal place than is present in the original data values.
-Last year, nine employees of an electronics company retired. Their ages at retirement are listed below. Find the mean retirement age. 52 63 67 50 59 58 65 51 56
(Multiple Choice)
5.0/5 (36)
Find the percentile for the data value.
- Data set: 112 124 116 110 118 120 110 108 115 112 116 126 108 112 114 109; data value: 118
(Multiple Choice)
4.9/5 (30)
Use the given sample data to find .
49 52 52 52 74 67 55 55
(Multiple Choice)
4.9/5 (33)
The textbook defines unusual values as those data points with scores less than or scores greater than . Comment on this definition with respect to Chebyshev's theorem; refer specifically to the percent of scores which would be defined as unusual according to Chebyshev's theorem.
(Essay)
4.7/5 (37)
Find the standard deviation of the data summarized in the given frequency distribution.
-A company had 80 employees whose salaries are summarized in the frequency distribution below. Find the standard deviation.
Salary (dollars) Employees 5,001-10,000 11 10,001-15,000 14 15,001-20,000 11 20,001-25,000 17 25,001-30,000 27
(Multiple Choice)
4.8/5 (32)
Find the range, variance, and standard deviation for each of the two samples, then compare the two sets of results.
-When investigating times required for drive-through service, the following results (in seconds) were obtained.
Restaurant A 120 123 153 128 124 118 154 110 Restaurant B 115 126 147 156 118 110 145 137
A) Restaurant A:
Restaurant B:
There is more variation in the times for restaurant A.
B) Restaurant A: 46 sec;
Restaurant B:
There is more variation in the times for restaurant .
C) Restaurant A:
Restaurant B:
There is more variation in the times for restaurant A.
D) Restaurant A:
Restaurant B:
There is more variation in the times for restaurant .
(Short Answer)
4.9/5 (31)
Find the range, variance, and standard deviation for each of the two samples, then compare the two sets of results.
-When investigating times required for drive-through service, the following results (in seconds) were obtained.
Restaurant A 120 67 89 97 124 68 72 96 Restaurant B 115 126 49 56 98 76 78 95
A) Restaurant A:
Restaurant B:
There is more variation in the times for restaurant .
B) Restaurant A:
Restaurant B:
There is more variation in the times for restaurant .
C) Restaurant A:
Restaurant B:
There is more variation in the times for restaurant .
D) Restaurant A:
Restaurant B:
There is more variation in the times for restaurant .
(Short Answer)
4.8/5 (35)
Find the standard deviation for the given sample data. Round your answer to one more decimal place than is present in the original data.
-To get the best deal on a CD player, Tom called eight appliance stores and asked the cost of a specific model. The prices he was quoted are listed below:
$304 $414 $428 $166 $385 $298 $250 $441
(Multiple Choice)
4.7/5 (32)
Find the variance for the given data. Round your answer to one more decimal place than the original data.
- 1.5 5.9 7.5 2.3 6.0
(Multiple Choice)
4.8/5 (30)
Determine which score corresponds to the higher relative position.
-Which is better, a score of 92 on a test with a mean of 71 and a standard deviation of 15, or a score of 688 on a test with a mean of 493 and a standard deviation of 150?
(Multiple Choice)
4.8/5 (27)
The table below provides a frequency distribution for the winner of the Davis Cup during the period 1977-1994.
Winner of Davis Cup Frequency United States 6 Germany 3 Czechoslovakia 1 Australia 3 France 1 Sweden 4
Which measure of center, the mean, the median, or the mode is most appropriate here? Why?
(Essay)
4.8/5 (37)
Filters
- Essay(0)
- Multiple Choice(0)
- Short Answer(0)
- True False(0)
- Matching(0)