Exam 12: Control Charts and Process Monitoring
Exam 1: Introduction to Statistics60 Questions
Exam 2: Exploring Data With Tables and Graphs60 Questions
Exam 3: Describing, Exploring, and Comparing Data60 Questions
Exam 4: Probability60 Questions
Exam 5: Discrete Probability Distributions59 Questions
Exam 6: Normal Probability Distributions58 Questions
Exam 7: Estimating Parameters and Determining Sample Sizes60 Questions
Exam 8: Hypothesis Testing60 Questions
Exam 9: Inferences From Two Samples60 Questions
Exam 10: Correlation and Regression60 Questions
Exam 11: Chi-Square and Analysis of Variance60 Questions
Exam 12: Control Charts and Process Monitoring178 Questions
Select questions type
Find the critical value. Assume that the test is two -tailed and that denotes the number of pairs of data.
(Multiple Choice)
4.9/5  (30)
(30)
Use the sign test to test the indicated claim. Fourteen people rated two brands of soda on a scale
of 1 to 5. Brand A 2 3 2 4 3 1 2 Brand B 1 4 5 5 1 2 3 Brand A 5 4 2 1 1 4 3 Brand B 4 5 5 2 4 5 4 At the 5 percent level, test the null hypothesis that the two brands of soda are equally popular.
(Essay)
4.8/5 (37)
Which statement is false about the Wilcoxon signed-ranks test?
(Multiple Choice)
4.8/5 (27)
Construct a run chart for individual values corresponding to the given data. A machine that is
supposed to produce ball bearings with a diameter of 7 millimeters yields the following data
from a test of 5 ball bearings every 20 minutes.
Sample Range 1 6.3 6.8 6.9 6.8 6.9 6.74 0.6 2 6.3 6.6 6.6 6.3 7.0 6.56 0.7 3 6.8 6.7 7.0 6.5 7.0 6.80 0.5 4 7.0 6.7 6.7 6.8 6.8 6.80 0.3 5 6.8 6.8 6.6 6.5 6.4 6.62 0.4 6 6.8 6.7 6.6 6.3 6.9 6.66 0.6 7 7.3 7.3 7.4 7.4 7.0 7.28 0.4 8 7.2 7.0 7.2 6.9 7.1 7.08 0.3 9 7.3 7.6 7.1 7.4 7.6 7.40 0.5 10 7.2 7.6 7.5 7.6 7.1 7.40 0.5 11 7.2 7.2 7.4 7.0 7.0 7.16 0.4 12 7.5 7.4 7.4 7.6 7.1 7.40 0.5
(Essay)
4.8/5 (31)
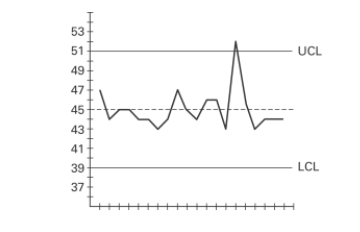
A control chart for is shown below. Determine whether the process mean is within statistical control. If it is not, identify which of the three out-of-control criteria lead to rejection of a statistically stable mean.
(Essay)
4.9/5 (26)
Suppose you are to test for equality of four different population means, with . Write the hypotheses for the paired tests. Use methods of
probability to explain why the process of ANOVA has a higher degree of confidence than
testing each of the pairs separately.
(Essay)
4.8/5 (32)
Test the claim that the samples come from populations with the same mean. Assume that the populations are normally distributed with the same variance. At the significance level, test the claim that the four brands have the same mean if the following sample results have been obtained.
Brand A Brand B Brand C Brand D 17 18 21 22 20 18 24 25 21 23 25 27 22 25 26 29 21 26 29 35 29 36 37
(Essay)
5.0/5 (37)
Use the sign test to test the indicated claim. The waiting times (in minutes)of 28 randomly
selected customers in a bank are given below. Use a significance level of 0.05 to test the claim
that the population median is equal to 5.3 minutes. 8.2 8.0 10.5 3.8 6.4 5.3 7.8 2.9 6.0 7.7 6.1 5.9 1.2 10.4 7.3 6.9 5.8 5.1 6.2 3.1 5.8 11.7 4.5 6.5 9.8 7.4 2.3 7.8
(Essay)
4.8/5 (31)
Which of the following is not one of the criteria for determining if a control chart indicates that a process is not statistically stable?
(Multiple Choice)
4.8/5 (32)
When applying the runs test for randomness above and below the median for 12 dollar/Euro
exchange rate highs, the test statistic is G = 2. What does that value tell us about the data?
(Essay)
4.9/5 (48)
Use a Kruskal-Wallis test to test the claim that the samples come from populations with equal
medians. Listed below are grade averages for randomly selected students with three different
categories of high-school background. At the 0.05 level of significance, test the claim that the
three groups have the same median grade average. HIGH SCHOOL RECORD Good Fair Poor 3.21 2.87 2.01 3.65 3.05 2.31 1.00 2.00 2.98 3.12 0.00 0.50 2.75 1.98 2.36
(Essay)
4.9/5 (39)
A _________________ is a sequential plot of individual data values over time. One axis is used for the data values, and the other axis is used for the time sequence.
(Multiple Choice)
4.7/5 (37)
Define statistically stable (or "within statistical control"). Show examples of run charts which
illustrate processes which are not statistically controlled. Discuss the pattern which indicates
the process is not statistically controlled for each example.
(Essay)
4.8/5 (32)
Why is it unnecessary to conduct multiple comparison tests after a nonsignificant F test
statistic results?
(Essay)
4.8/5 (35)
Four different judges each rank the quality of 20 different singers. What method can be used for agreement among the four judges?
(Multiple Choice)
4.8/5 (33)
Use a Kruskal-Wallis test to test the claim that the samples come from populations with equal medians. SAT scores for students selected randomly from three different schools are shown
Below. Use a significance level of 0.05 to test the claim that the students from the three
Schools had the same median SAT score. School 1 School 2 School 3
550 480 670 460 580 620 500 620 700
400 600 520 380 600 470 450 550 760 What would be the value of R1 that would be used in finding H?
(Multiple Choice)
4.9/5 (31)
Use the Wilcoxon signed -ranks test to test the claim that the matched pairs have differences
that come from a population with a median equal to zero. Eleven runners are timed at the 100-
meter dash and are timed again one month later after following a new training program. The
times (in seconds)are shown in the table. Use Wilcoxon's signed-ranks test and a significance
level of 0.05 to test the claim that the training has no effect on the times. Before 12.1 12.4 11.7 11.5 11.0 11.8 12.3 10.8 12.6 12.7 10.7 After 11.9 12.4 11.8 11.4 11.2 11.5 12.0 10.9 12.0 12.2 11.1
(Essay)
4.9/5 (32)
Explain the procedure for two-way analysis of variance, and how it varies depending on
whether there is an interaction between the two factors or not.
(Essay)
4.7/5 (35)
Match the parametric test with its comparable nonparametric test.
Correct Answer: Verified
Premises:
Responses:
(Matching)
4.8/5 (38)
Use the given process data to construct a control chart for p. A drugstore considers a wait of
more than 5 minutes to be a defect. Each week 100 customers are randomly selected and
timed at the checkout line. The numbers of defects for 20 consecutive weeks are given below. 4 4 5 5 5 5 5 6 6 6 6 12 6 6 6 7 6 7 8 7
(Essay)
4.9/5 (32)
Filters
- Essay(0)
- Multiple Choice(0)
- Short Answer(0)
- True False(0)
- Matching(0)