Exam 12: Control Charts and Process Monitoring
Exam 1: Introduction to Statistics60 Questions
Exam 2: Exploring Data With Tables and Graphs60 Questions
Exam 3: Describing, Exploring, and Comparing Data60 Questions
Exam 4: Probability60 Questions
Exam 5: Discrete Probability Distributions59 Questions
Exam 6: Normal Probability Distributions58 Questions
Exam 7: Estimating Parameters and Determining Sample Sizes60 Questions
Exam 8: Hypothesis Testing60 Questions
Exam 9: Inferences From Two Samples60 Questions
Exam 10: Correlation and Regression60 Questions
Exam 11: Chi-Square and Analysis of Variance60 Questions
Exam 12: Control Charts and Process Monitoring178 Questions
Select questions type
Which of the following is NOT a requirement for one-way ANOVA?
(Multiple Choice)
4.8/5  (40)
(40)
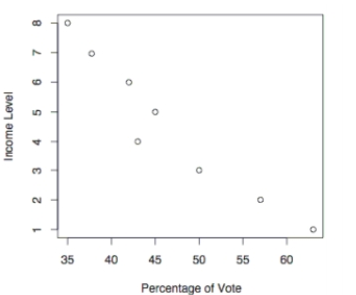
The following scatterplot shows the percentage of the vote a candidate received in the 2004 senatorial elections according to the voter's income level based on an exit poll of voters
Conducted by CNN. The income levels 1 -8 correspond to the following income classes: Use the election scatterplot to the find the critical values corresponding to a significance level used to test the null hypothesis of .
(Multiple Choice)
4.8/5 (31)
A control chart for attributes is to be constructed.
limits, a process which has been having a 5% rate of nonconforming items, or a process which
has been having a 10% of nonconforming items? Assume that both processes have the same
sample sizes. For a given sample size, would it be easier to detect a shift from 5% to 10% or a
shift from 10% to 15%? Explain your reasoning.
(Essay)
4.9/5 (34)
Are control charts based on actual behavior or on desired behavior? Give an example to
illustrate the difference between the two types of behavior.
(Essay)
4.8/5 (32)
List the assumptions for testing hypotheses that three or more means are equivalent.
(Essay)
4.8/5 (40)
Use the data in the given table and the corresponding Minitab display to test the hypothesis.
The following table shows the mileage for four different cars and three different brands of
gas. Assuming no effect from the interaction between car and brand of gas, test the claim that
the four cars have the same mean mileage. Use a 0.05 significance level. Brand 1 Brand 2 Brand 3 Car 1 22.4 25.2 24.3 Car 2 19 18.6 19.8 Car 3 24.6 25 25.4 Car 4 23.5 23.6 24.1
Source DF SS MS F p Car 3 61.249 20.416 39.033 0.000249 Gas 2 2.222 1.111 2.124 0.200726 Error 6 3.138 0.523 Total 11 66.609
(Essay)
4.7/5 (34)
Use the Minitab display to test the indicated claim. A manager records the production output
of three employees who each work on three different machines for three different days. The
sample results are given below and the Minitab results follow. Employee I 31,34,32 29,23,22 21,20,24 Machine II 19,26,22 35,33,30 25,19,23 III 21,18,26 20,23,24 36,37,31
SOURCE DF SS MS MACHINE 2 1.19 .59 EMPLOYEE 2 5.85 2.93 INTERACTION 4 710.81 177.70 ERROR 18 160.00 8.89 TOTAL 26 877.85 Assume that the number of items produced is not affected by an interaction between
employee and machine. Using a 0.05 significance level, test the claim that the machine has no
effect on the number of items produced.
(Essay)
4.9/5 (34)
Describe a p chart and give an example. What does it attempt to monitor?
(Essay)
4.8/5 (34)
Construct an R chart and determine whether the process variation is within statistical control.
n 2 1.880 2.659 0.000 3.267 0.000 3.267 3 1.023 1.954 0.000 2.568 0.000 2.574 4 0.729 1.628 0.000 2.266 0.000 2.282 5 0.577 1.427 0.000 2.089 0.000 2.114 6 0.483 1.287 0.030 1.970 0.000 2.004 7 0.419 1.182 0.118 1.882 0.076 1.924 8 0.373 1.099 0.185 1.815 0.136 1.864 9 0.337 1.032 0.239 1.761 0.184 1.816 10 0.308 0.975 0.284 1.716 0.223 1.777
A machine that is supposed to produce ball bearings with a diameter of 7 millimeters yields the following data from a test of 5 ball bearings every 20 minutes.
Sample Range 1 6.3 6.8 6.9 6.8 6.9 6.74 0.6 2 6.3 6.6 6.6 6.3 7.0 6.56 0.7 3 6.8 6.7 7.0 6.5 7.0 6.80 0.5 4 7.0 6.7 6.7 6.8 6.8 6.80 0.3 5 6.8 6.8 6.6 6.5 6.4 6.62 0.4 6 6.8 6.7 6.6 6.3 6.9 6.66 0.6 7 7.3 7.3 7.4 7.4 7.0 7.28 0.4 8 7.2 7.0 7.2 6.9 7.1 7.08 0.3 9 7.3 7.6 7.1 7.4 7.6 7.40 0.5 10 7.2 7.6 7.5 7.6 7.1 7.40 0.5 11 7.2 7.2 7.4 7.0 7.0 7.16 0.4 12 7.5 7.4 7.4 7.6 7.1 7.40 0.5
(Essay)
4.9/5 (27)
Test the claim that the samples come from populations with the same mean. Assume that the
populations are normally distributed with the same variance. At the 0.025 significance level,
test the claim that the four brands have the same mean if the following sample results have
been obtained. Brand A Brand B Brand C Brand D 17 18 21 22 20 18 24 25 21 23 25 27 22 25 26 29 21 26 29 35 29 36 37
(Essay)
4.9/5 (38)
Use the data in the given table and the corresponding Minitab display to test the hypothesis?
The following table entries are test scores for males and females at different times of day.
Assuming no effect from the interaction between gender and test time, test the claim that time
of day does not affect test scores. Use a 0.05 significance level. 6 a.m. - 9 a.m. 9 a.m. - 12 p.m. 12 p.m. - p.m. p.m. - p.m. Male 87 89 92 85 Female 72 84 94 89
Source DF SS MS F p Gender 1 24.5 24.5 0.6652 0.4745 Time 3 183 61 1.6561 0.3444 Error 3 110.5 36.83 Total 7 318
(Essay)
4.7/5 (32)
Describe the runs test for randomness. What types of hypotheses is it used to test? Does the
runs test measure frequency? What is the underlying concept?
(Essay)
4.9/5 (45)
Provide the appropriate response. Describe the Wilcoxon signed-ranks test. What types of
hypotheses is it used to test? What assumptions are made for this test?
(Essay)
4.9/5 (29)
Suppose you are to test for equality of four different population means, with . Write the hypotheses for the paired tests. Use methods of probability to explain why the process of ANOVA has a higher degree of confidence than testing each of the pairs separately.
(Essay)
4.8/5 (30)
Control charts are used to monitor changing characteristics of data over ____________.
(Multiple Choice)
4.7/5 (39)
Match the chart with its characteristic. A) Run chart 1) Each sample belongs to one of two categories (such as defective or not defective). B) R chart 2) It has no upper or lower control limits. C) chart 3) The centerline is D) p chart 4) Monitors variation in a process.
(Essay)
4.9/5 (40)
Use the runs test to determine whether the given sequence is random. Use a significance level
of 0.05. A sample of 30 clock radios is selected in sequence from an assembly line. Each
radio is examined and judged to be acceptable (A)or defective (D). The results are shown
below. Test for randomness. A A D A A A D A A D
A D A A A D A A A A
A A D D A A A A D A
(Essay)
4.8/5 (37)
Use the rank correlation coefficient to test for a correlation between the two variables. A
placement test is required for students desiring to take a finite mathematics course at a
university. The instructor of the course studies the relationship between students' placement
test score and final course score. A random sample of eight students yields the following data. 38 63 90 41 95 54 51 32 86 93 74 60 60 61 57 89 Compute the rank correlation coefficient, rs, of the data and test the claim of correlation
between placement score and final course score. Use a significance level of 0.05.
(Essay)
4.8/5 (38)
The test statistic for one-way ANOVA is equal to _________________.
(Multiple Choice)
4.8/5 (41)
Fill in the missing entries in the following partially completed one -way ANOVA table. Source df SS MS=SS/df F -statistic Treatment 3 11.16 Error 13.72 0.686 Total
(Multiple Choice)
4.8/5 (28)
Filters
- Essay(0)
- Multiple Choice(0)
- Short Answer(0)
- True False(0)
- Matching(0)