Exam 12: Control Charts and Process Monitoring
Exam 1: Introduction to Statistics60 Questions
Exam 2: Exploring Data With Tables and Graphs60 Questions
Exam 3: Describing, Exploring, and Comparing Data60 Questions
Exam 4: Probability60 Questions
Exam 5: Discrete Probability Distributions59 Questions
Exam 6: Normal Probability Distributions58 Questions
Exam 7: Estimating Parameters and Determining Sample Sizes60 Questions
Exam 8: Hypothesis Testing60 Questions
Exam 9: Inferences From Two Samples60 Questions
Exam 10: Correlation and Regression60 Questions
Exam 11: Chi-Square and Analysis of Variance60 Questions
Exam 12: Control Charts and Process Monitoring178 Questions
Select questions type
n 2 1.880 2.659 0.000 3.267 0.000 3.267 3 1.023 1.954 0.000 2.568 0.000 2.574 4 0.729 1.628 0.000 2.266 0.000 2.282 5 0.577 1.427 0.000 2.089 0.000 2.114 6 0.483 1.287 0.030 1.970 0.000 2.004 7 0.419 1.182 0.118 1.882 0.076 1.924 8 0.373 1.099 0.185 1.815 0.136 1.864 9 0.337 1.032 0.239 1.761 0.184 1.816 10 0.308 0.975 0.284 1.716 0.223 1.777
A machine that is supposed to produce ball bearings with a diameter of 7 millimeters yields the following data from a test of 5 ball bearings every 20 minutes.
Sample Range 1 6.3 6.8 6.9 6.8 6.9 6.74 0.6 2 6.3 6.6 6.6 6.3 7.0 6.56 0.7 3 6.8 6.7 7.0 6.5 7.0 6.80 0.5 4 7.0 6.7 6.7 6.8 6.8 6.80 0.3 5 6.8 6.8 6.6 6.5 6.4 6.62 0.4 6 6.8 6.7 6.6 6.3 6.9 6.66 0.6 7 7.3 7.3 7.4 7.4 7.0 7.28 0.4 8 7.2 7.0 7.2 6.9 7.1 7.08 0.3 9 7.3 7.6 7.1 7.4 7.6 7.40 0.5 10 7.2 7.6 7.5 7.6 7.1 7.40 0.5 11 7.2 7.2 7.4 7.0 7.0 7.16 0.4 12 7.5 7.4 7.4 7.6 7.1 7.40 0.5
(Essay)
4.9/5  (33)
(33)
The
values are given. Is there a significant effect from the interaction? Should you test to see if
there is a significant effect due to either A or B? If the answer is yes, is there a significant
effect due to either A or B? Source DF Sum squares Mean square F test P-value A 2 164.020 82.010 25.010 <.0001 B 4 230.786 57.697 18.002 <.0001 Interaction Error Total 8 80.879 10.110 3.154 .0031 101 323.708 3.205 115 799.393
(Essay)
4.7/5 (38)
The data below represent the weight losses for people on three diets. Diet A Diet B Diet C 1.75 3.8 4.8 8.8 4.9 6.2 7.3 1.1 5.8 9.8 7.8 8.1 5.1 1.2 6.9
If we want to test the claim that the three size categories have the same means, why don't we use three separate hypothesis tests for , and ?
(Essay)
4.8/5 (35)
If test A has an efficiency rating of 0.94 as compared to test B, explain what that efficiency
rating means. Do comparable nonparametric or parametric tests have higher efficiency
ratings?
(Essay)
4.9/5 (29)
The following data contains task completion times, in minutes, categorized according to the
gender of the machine operator and the machine used. Male Female Machine 1 15,17 16,17 Machine 2 14,13 15,13 Machine 3 16,18 17,19 Assume that two-way ANOVA is used to analyze the data. How are the ANOVA results
affected if 5 minutes is added to each completion time?
(Essay)
4.8/5 (43)
Test the claim that the samples come from populations with the same mean. Assume that the
populations are normally distributed with the same variance. The data below represent the
weight losses for people on three different exercise programs. Exercise A Exercise B Exercise C 2.5 5.8 4.3 8.8 4.9 6.2 7.3 1.1 5.8 9.8 7.8 8.1 5.1 1.2 7.9 At the 1% significance level, does it appear that a difference exists in the true mean weight
loss produced by the three exercise programs?
(Essay)
5.0/5 (37)
The following scatterplot shows the percentage of the vote a candidate received in the 2004 senatorial elections according to the voter's income level based on an exit poll of voters
Conducted by CNN. The income levels 1 -8 correspond to the following income classes: Under -
150, or more.
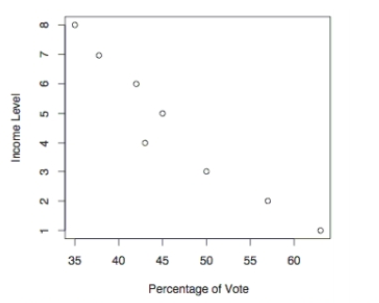 Use the election scatterplot to determine whether there is a correlation between percentage of vote and income level at the significance level with a null hypothesis of .
(Multiple Choice)
4.7/5 (23)
n 2 1.880 2.659 0.000 3.267 0.000 3.267 3 1.023 1.954 0.000 2.568 0.000 2.574 4 0.729 1.628 0.000 2.266 0.000 2.282 5 0.577 1.427 0.000 2.089 0.000 2.114 6 0.483 1.287 0.030 1.970 0.000 2.004 7 0.419 1.182 0.118 1.882 0.076 1.924 8 0.373 1.099 0.185 1.815 0.136 1.864 9 0.337 1.032 0.239 1.761 0.184 1.816 10 0.308 0.975 0.284 1.716 0.223 1.777
A machine is supposed to fill boxes to a weight of 50 pounds. Every 30 minutes a sample of four boxes is tested; the results are given below.
1 2 3 4 5 6 7 8 9 10 11 12 13 14 15 49 38 39 45 52 51 43 61 56 60 32 52 44 59 46 49 51 61 48 45 45 50 46 48 52 51 45 55 40 50 53 48 48 67 60 51 43 50 50 47 48 30 38 39 50 46 48 53 50 58 56 64 47 52 47 49 52 57 58 52 42.75 51.75 50.00 49.50 51.25 47.25 50.75 47.75 56.50 47.50 38.75 49.25 57.00 48.75 54.75 Range 11 18 28 15 16 5 10 13 19 7 18 7 14 5 6
(Essay)
4.9/5 (36)
Use a 0.05 level of significance to test the claim that the sequence of computer -generated
numbers is random. Test for randomness above and below the mean.
(Essay)
4.7/5 (29)
Use the sign test to test the indicated claim. An instructor gives a test before and after a lesson
and results from randomly selected students are given below. At the 0.05 level of significance,
test the claim that the lesson has no effect on the grade. Use the sign test. Before 54 61 56 41 38 57 42 71 88 42 36 23 22 46 51 After 82 87 84 76 79 87 42 97 99 74 85 96 69 84 79
(Essay)
4.9/5 (33)
Test the claim that the samples come from populations with the same mean. Assume that the
populations are normally distributed with the same variance. At the 0.025 significance level,
test the claim that the three brands have the same mean if the following sample results have
been obtained. Brand A Brand B Brand 32 27 22 34 24 25 37 33 32 33 30 22 36 21 39
(Essay)
4.7/5 (38)
Define rank. Explain how to find the rank for data which repeats (for example, the data set: 4,
5, 5, 5, 7, 8, 12, 12, 15, 18).
(Essay)
5.0/5 (26)
Use the Wilcoxon rank-sum approach to test the claim that the two independent sample student
grade averages at two colleges come from populations with equal medians. The sample data is
listed below. Use a 0.05 level of significance, and assume that the samples were randomly
selected. College A 3.2 4.0 2.4 2.6 2.0 1.8 1.3 0.0 0.5 1.4 2.9 College B 2.4 1.9 0.3 0.8 2.8 3.0 3.1 3.1 3.1 3.5 3.5
(Essay)
4.9/5 (37)
A machine is supposed to fill boxes to a weight of 50 pounds. Every 30 minutes a sample of four boxes is tested; the results are given below.
What would be the value of the centerline that would be used in creating an R chart?
Sample 1 49 38 39 45 42.75 2 52 51 43 61 51.75 3 56 60 32 52 50.00 4 44 59 46 49 49.50 5 51 61 48 45 51.25 6 45 50 46 48 47.25 7 52 51 45 55 50.75 8 40 50 53 48 47.75 9 48 67 60 51 56.50 10 43 50 50 47 47.50 11 48 30 38 39 38.75 12 50 46 48 53 49.25 13 50 58 56 64 57.00 14 47 52 47 49 48.75 15 52 57 58 52 54.75
(Multiple Choice)
4.8/5 (34)
Use the data in the given table and the corresponding Minitab display to test the hypothesis.
The following table shows the mileage for four different cars and three different brands of
gas. Assuming no effect from the interaction between car and brand of gas, test the claim
that the four cars have the same mean mileage. Use a 0.05 significance level. Brand 1 Brand 2 Brand 3 Car 1 22.4 25.2 24.3 Car 2 19 18.6 19.8 Car 3 24.6 25 25.4 Car 4 23.5 23.6 24.1
Source DF SS MS F p Car 3 61.249 20.416 39.033 0.000249 Gas 2 2.222 1.111 2.124 0.200726 Error 6 3.138 0.523 Total 11 66.609
(Essay)
4.9/5 (25)
Use the given process data to construct a control chart for p. If the weight of cereal in a
particular packet is less than 14 ounces, the packet is considered nonconforming. Each week,
the manufacturer randomly selects 1,000 cereal packets and determines the number that are
nonconforming. The results for 12 consecutive weeks are shown below. 46 32 21 30 47 31 32 52 48 45 62 58
(Essay)
4.8/5 (40)
Use the given process data to construct a control chart for p. A manufacturer monitors the level
of defects in the television sets that it produces. Each week, 200 television sets are randomly
selected and tested and the number of defects is recorded. The results for 12 consecutive weeks
are shown below. 4 7 5 6 8 3 12 4 4 5 6 2
(Essay)
4.8/5 (33)
Which type of chart would be best for monitoring the proportion of items that are defective?
(Multiple Choice)
4.9/5 (29)
Which of the following is not an application of the sign test?
(Multiple Choice)
4.9/5 (32)
Given below are the analysis of variance results from a Minitab display. to use a 0.05 significance level in testing the null hypothesis that the different samples come
From populations with the same mean. Identify the value of the test statistic. Source Factor 3 13.500 4.500 5.17 0.011 Error 16 13.925 0.870 Total 19 27.425
(Multiple Choice)
4.8/5 (35)
Filters
- Essay(0)
- Multiple Choice(0)
- Short Answer(0)
- True False(0)
- Matching(0)