Exam 12: Control Charts and Process Monitoring
Exam 1: Introduction to Statistics60 Questions
Exam 2: Exploring Data With Tables and Graphs60 Questions
Exam 3: Describing, Exploring, and Comparing Data60 Questions
Exam 4: Probability60 Questions
Exam 5: Discrete Probability Distributions59 Questions
Exam 6: Normal Probability Distributions58 Questions
Exam 7: Estimating Parameters and Determining Sample Sizes60 Questions
Exam 8: Hypothesis Testing60 Questions
Exam 9: Inferences From Two Samples60 Questions
Exam 10: Correlation and Regression60 Questions
Exam 11: Chi-Square and Analysis of Variance60 Questions
Exam 12: Control Charts and Process Monitoring178 Questions
Select questions type
Examine the given run chart or control chart and determine whether the process is within
statistical control. If it is not, identify which of the three out-of-statistical-control criteria apply. 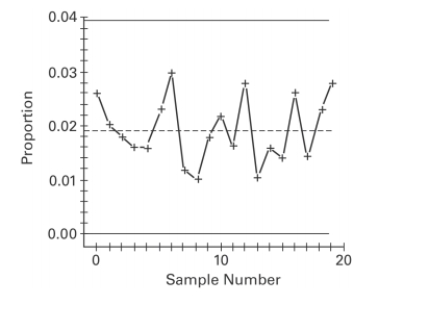
(Essay)
4.8/5  (28)
(28)
At the same time each day, a researcher records the temperature in each of three classrooms? The table shows the temperatures in degrees Fahrenheit recorded for one week. Classroom \#1 Classroom \#2 Classroom \#3 78 71 77 75 69 73 73 72 72 66 72 71 68 65 70 71 73 62 72 71 79 How are the analysis of variance results affected if the same constant is added to every one of
The original sample values?
(Multiple Choice)
4.9/5 (29)
A manufacturer of lightbulbs picks 10 lightbulbs at random each day for quality control. The mean and range (in hours)of the lifetimes of the 10 lightbulbs are calculated. The results for
12 consecutive days are shown in the table below. Construct an R chart to determine whether
The process is in statistical control. Day Range s 1 201.1 3.4 1.2 2 203.4 4.7 1.7 3 200.9 3.1 0.9 4 205.6 6.2 2.3 5 201.3 4.7 1.3 6 200.5 3.7 1.7 7 205.8 5.8 2.1 8 203.7 6.2 2.9 9 199.8 2.1 0.8 10 202.7 4.4 1.6 11 200.0 2.7 0.7 12 204.6 7.8 3.0
n 2 1.880 2.659 0.000 3.267 0.000 3.267 3 1.023 1.954 0.000 2.568 0.000 2.574 4 0.729 1.628 0.000 2.266 0.000 2.282 5 0.577 1.427 0.000 2.089 0.000 2.114 6 0.483 1.287 0.030 1.970 0.000 2.004 7 0.419 1.182 0.118 1.882 0.076 1.924 8 0.373 1.099 0.185 1.815 0.136 1.864 9 0.337 1.032 0.239 1.761 0.184 1.816 10 0.308 0.975 0.284 1.716 0.223 1.777
(Multiple Choice)
4.8/5 (31)
Use the rank correlation coefficient to test for a correlation between the two variables?
Ten trucks were ranked according to their comfort levels and their prices. Make Comfort Price A 1 6 B 6 2 C 2 3 D 8 1 E 4 4 F 7 8 G 9 10 H 10 9 I 3 5 J 5 7 Find the rank correlation coefficient and test the claim of correlation between comfort and
price. Use a significance level of 0.05.
(Essay)
4.8/5 (38)
At the same time each day, a researcher records the temperature in each of three greenhouses? The table shows the temperatures in degrees Fahrenheit recorded for one week. Greenhouse \#1 Greenhouse \#2 Greenhouse \#3 73 71 67 72 69 63 73 72 62 66 72 61 68 65 60 71 73 62 72 71 59 What type of test would you use to test the claim that the average temperature is the same in
Each greenhouse at a 0.05 significance level?
(Multiple Choice)
4.9/5 (39)
Use the given process data to construct a control chart for p. A drugstore considers a wait of more than 5 minutes to be a defect. Each week 100 customers are randomly selected and
Timed at the checkout line. The numbers of defects for 20 consecutive weeks are given below. 4 4 5 5 5 5 5 6 6 6 6 12 6 6 6 7 6 7 8 7
What is the value of the upper control limit?
(Multiple Choice)
4.7/5 (32)
In a study of the effectiveness of physical exercise in weight reduction, 12 subjects followed a program of physical exercise for two months. Their weights (in pounds)before and after this
Program are shown in the table. Use Wilcoxon's signed -ranks test and a significance level of
0)05 to test the claim that the exercise program has no effect on weight. Before 162 190 188 152 148 127 195 164 175 156 180 136 After 157 194 179 149 135 130 183 168 168 148 170 138 What would be the signed rank for the column with values of 175 and 168?
(Multiple Choice)
4.9/5 (36)
Which of the following distribution-free tests has the lowest efficiency rating compared to its parametric counterpart?
(Multiple Choice)
4.9/5 (26)
Use the sign test to test the indicated claim. The heights of 16 randomly selected women are
given below. Use a significance level of 0.05 to test the claim that the population median is
equal to 64.0 inches. 62.9 61.9 66.4 68.5 63.7 64.0 65.2 67.0 70.2 65.3 64.0 60.3 64.3 66.9 65.0 63.8
(Essay)
4.8/5 (29)
Given below are the analysis of variance results from a Minitab display. to use a 0.05 significance level in testing the null hypothesis that the different samples come
From populations with the same mean. Find the critical value. Source DF SS MS F p Factor 3 30 10.00 1.6 0.264 Error 8 50 6.25 Total 11 80
(Multiple Choice)
4.9/5 (44)
A run chart for individual values is shown below. Does there appear to be a pattern suggesting
that the process is not within statistical control? If so, describe the pattern. 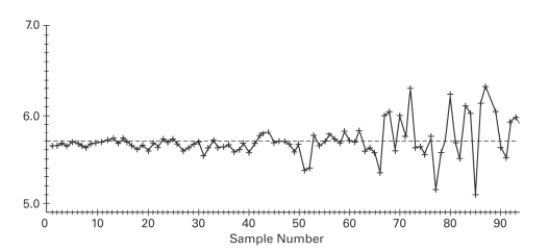
(Essay)
4.7/5 (42)
Use the Minitab display to test the indicated claim. A manager records the production output of
three employees who each work on three different machines for three different days. The
sample results are given below and the Minitab results follow. Employee I 23,27,29 30,27,25 18,20,22 Machine II 25,26,24 24,29,26 19,16,14 III 28,25,26 25,27,23 15,11,17
SOURCE DF SS MS MACHINE 2 34.67 17.33 EMPLOYEE 2 504.67 252.33 INTERACTION 4 26.67 6.67 ERROR 18 98.00 5.44 TOTAL 26 664.00 Assume that the number of items produced is not affected by an interaction between
employee and machine. Using a 0.05 significance level, test the claim that the machine has no
effect on the number of items produced.
(Essay)
4.8/5 (43)
Examine the given run chart or control chart and determine whether the process is within statistical control. 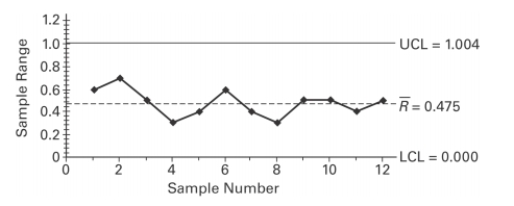
(Multiple Choice)
4.7/5 (31)
List the assumptions for testing hypotheses that three or more means are equivalent.
(Essay)
4.7/5 (35)
Use the runs test to determine whether the given sequence is random. Use a significance level of . The outcomes (odd number or even number) of a roulette wheel are shown below. Test for randomness of odd and even (E) numbers. Use a significance level of .
O
What is the value of , the number of runs?
(Multiple Choice)
4.9/5 (37)
Consider process data consisting of the amounts of potato chips (in ounces)in randomly selected bags of chips. The process is to be monitored with control charts based on samples
Of 50 bags randomly selected each day for 15 consecutive days of production. What does denote?
(Multiple Choice)
4.8/5 (34)
A standard aptitude test is given to several randomly selected programmers, and the scores are
given below for the mathematics and verbal portions of the test. Use the sign test to test the
claim that programmers do better on the mathematics portion of the test. Use a 0.05 level of
significance. Mathematics 347 440 327 456 427 349 377 398 425 Verbal 285 378 243 371 340 271 294 322 385
(Essay)
4.8/5 (38)
Do parametric or nonparametric tests have higher efficiency ratings?
(Multiple Choice)
4.7/5 (41)
Examine the given run chart or control chart and determine whether the process is within statistical control. 
(Multiple Choice)
4.9/5 (36)
Use a Kruskal-Wallis test to test the claim that the samples come from populations with equal
medians. Listed below are grade averages for randomly selected students with three different
categories of high-school background. At the 0.05 level of significance, test the claim that the
three groups have the same median grade average. HIGH SCHOOL RECORD Good Fair Poor 3.21 2.87 2.01 3.65 3.05 2.31 1.00 2.00 2.98 3.12 0.00 0.50 2.75 1.98 2.36
(Essay)
4.8/5 (28)
Filters
- Essay(0)
- Multiple Choice(0)
- Short Answer(0)
- True False(0)
- Matching(0)