Exam 12: Control Charts and Process Monitoring
Exam 1: Introduction to Statistics60 Questions
Exam 2: Exploring Data With Tables and Graphs60 Questions
Exam 3: Describing, Exploring, and Comparing Data60 Questions
Exam 4: Probability60 Questions
Exam 5: Discrete Probability Distributions59 Questions
Exam 6: Normal Probability Distributions58 Questions
Exam 7: Estimating Parameters and Determining Sample Sizes60 Questions
Exam 8: Hypothesis Testing60 Questions
Exam 9: Inferences From Two Samples60 Questions
Exam 10: Correlation and Regression60 Questions
Exam 11: Chi-Square and Analysis of Variance60 Questions
Exam 12: Control Charts and Process Monitoring178 Questions
Select questions type
Draw an example of an F distribution and list the characteristics of the F distribution?
(Essay)
4.9/5  (34)
(34)
Use the data in the given table and the corresponding Minitab display to test the hypothesis.
The following table shows the mileage for four different cars and three different brands of
gas. Assuming no effect from the interaction between car and brand of gas, test the claim that
the three brands of gas provide the same mean gas mileage. Use a 0.05 significance level. Brand 1 Brand 2 Brand 3 Car 1 22.4 25.2 24.3 Car 2 19 18.6 19.8 Car 3 24.6 25 25.4 Car 4 23.5 23.6 24.1
Source DF SS MS F p Car 3 61.249 20.416 39.033 0.000249 Gas 2 2.222 1.111 2.124 0.200726 Error 6 3.138 0.523 Total 11 66.609
(Essay)
4.9/5 (48)
Use the rank correlation coefficient to test for a correlation between the two variables.
Given that the rank correlation coefficient, rs, for 37 pairs of data is 0.324, test the claim of
correlation between the two variables. Use a significance level of 0.01.
(Essay)
4.8/5 (33)
Test the claim that the samples come from populations with the same mean. Assume that the
populations are normally distributed with the same variance. Exercise A Exercise B Exercise 2.5 5.8 4.3 8.8 4.9 6.2 7.3 1.1 5.8 9.8 7.8 8.1 5.1 1.2 7.9 At the 1% significance level, does it appear that a difference exists in the true mean weight
loss produced by the three exercise programs?
(Essay)
4.8/5 (30)
Describe the sign test. What types of hypotheses is it used to test? What is the underlying
concept?
(Essay)
4.8/5 (40)
Use the Minitab display to test the indicated claim. A manager records the production output of three employees who each work on three different machines for three different days. The
Sample results are given below and the Minitab results follow. Employee I 16,18,19 15,17,20 14,18,16 Machine II 20,27,29 25,28,27 29,28,26 III 15,18,17 16,16,19 13,17,16
SOURCE DF SS MS MACHINE 2 588.74 294.37 EMPLOYEE 2 2.07 1.04 INTERACTION 4 15.48 3.87 ERROR 18 98.67 5.48 TOTAL 26 704.96 Assume that the number of items produced is not affected by an interaction between
Employee and machine. Using a 0.05 significance level, test the claim that the choice of
Employee has no effect on the number of items produced. What is the value of the test
Statistic, F?
(Multiple Choice)
4.9/5 (27)
Construct a run chart for individual values corresponding to the given data. A machine is
supposed to fill boxes to a weight of 50 pounds. Every 30 minutes a sample of four boxes is
tested; the results are given below.
1 2 3 4 5 6 7 8 9 10 11 12 13 14 15 49 38 39 45 52 51 43 61 56 60 32 52 44 59 46 49 51 61 48 45 45 50 46 48 52 51 45 55 40 50 53 48 48 67 60 51 43 50 50 47 48 30 38 39 50 46 48 53 50 58 56 64 47 52 47 49 52 57 58 52 42.75 51.75 50.00 49.50 51.25 47.25 50.75 47.75 56.50 47.50 38.75 49.25 57.00 48.75 54.75 Range 11 18 28 15 16 5 10 13 19 7 18 7 14 5 6
(Essay)
4.9/5 (30)
Which graph using individual data values instead of a process characteristic?
(Multiple Choice)
4.8/5 (35)
Why do researchers concentrate on explaining an interaction in a two -way ANOVA rather
than the effects of each factor separately?
(Essay)
4.7/5 (40)
A common goal of quality control is to reduce variation in a product or service. List and
describe the two types of variability. Give an example of each.
(Essay)
4.8/5 (38)
The following data contains task completion times, in minutes, categorized according to the
gender of the machine operator and the machine used. Male Female Machine 1 15,17 16,17 Machine 2 14,13 15,13 Machine 3 16,18 17,19 Assume that two-way ANOVA is used to analyze the data. How are the ANOVA results
affected if the times are converted to hours?
(Essay)
4.9/5 (37)
The data below represent the weight losses for people on three different exercise programs. Exercise A Exercise B Exercise C 2.5 5.8 4.3 8.8 4.9 6.2 7.3 1.1 5.8 9.8 7.8 8.1 5.1 1.2 7.9 If we want to test the claim that the three size categories have the same means, why don't we
use three separate hypothesis tests for
(Essay)
4.8/5 (30)
Assume that the number of items produced is not affected by an interaction between employee
and machine. Using a 0.05 significance level, test the claim that the machine has no effect on
the number of items produced. Employee I 16,18,19 15,17,20 14,18,16 Machine II 20,27,29 25,28,27 29,28,26 III 15,18,17 16,16,19 13,17,16
SOURCE DF SS MS MACHINE 2 588.74 294.37 EMPLOYEE 2 2.07 1.04 INTERACTION 4 15.48 3.87 ERROR 18 98.67 5.48 TOTAL 26 704.96 Using a 0.05 significance level, test the claim that the interaction between employee and
machine has no effect on the number of items produced.
(Essay)
4.8/5 (38)
The following data shows the yield, in bushels per acre, categorized according to three
varieties of corn and three different soil conditions. Assume that yields are not affected by an
interaction between variety and soil conditions, and test the null hypothesis that variety has no
effect on yield. Use a 0.05 significance level. Plot 1 Plot 2 Plot 3 Variety 1 156,167, 162,160, 145,151, 170,162 169,168 148,155 Variety 2 172,176, 179,186, 161,162, 166,179 160,176 165,170 Variety 3 175,157, 178,170, 169,165, 179,178 172,174 170,169
(Essay)
4.8/5 (41)
Examine the given run chart or control chart and determine whether the process is within
statistical control. If it is not, identify which of the three out-of-statistical-control criteria
apply. 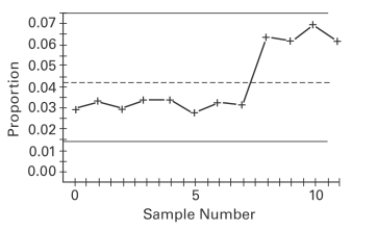
(Essay)
4.7/5 (32)
The following data contains task completion times, in minutes, categorized according to the
gender of the machine operator and the machine used. Male Female Machine 1 15,17 16,17 Machine 2 14,13 15,13 Machine 3 16,18 17,19 The ANOVA results lead us to conclude that the completion times are not affected by an
interaction between machine and gender, and the times are not affected by gender, but they
are affected by the machine. Change the table entries so that there is no effect from the
interaction between machine and gender, but there is an effect from the gender of the
operator.
(Essay)
4.7/5 (32)
The test statistics for one-way ANOVA is .
Describe variance .
within samples and variance between samples. What relationship does variance within
samples and variance between samples would result in the conclusion that the value of F is
significant?
(Essay)
4.8/5 (47)
Describe a run chart and give an example. Refer to the values on each of the axes as you
describe the run chart.
(Essay)
4.9/5 (33)
Filters
- Essay(0)
- Multiple Choice(0)
- Short Answer(0)
- True False(0)
- Matching(0)