Exam 12: Control Charts and Process Monitoring
Exam 1: Introduction to Statistics60 Questions
Exam 2: Exploring Data With Tables and Graphs60 Questions
Exam 3: Describing, Exploring, and Comparing Data60 Questions
Exam 4: Probability60 Questions
Exam 5: Discrete Probability Distributions59 Questions
Exam 6: Normal Probability Distributions58 Questions
Exam 7: Estimating Parameters and Determining Sample Sizes60 Questions
Exam 8: Hypothesis Testing60 Questions
Exam 9: Inferences From Two Samples60 Questions
Exam 10: Correlation and Regression60 Questions
Exam 11: Chi-Square and Analysis of Variance60 Questions
Exam 12: Control Charts and Process Monitoring178 Questions
Select questions type
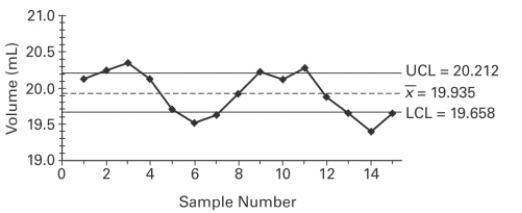
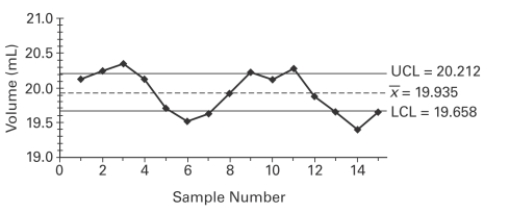
A control chart for is shown below. Determine whether the process mean is within statistical control. If it is not, identify which of the three out-of-control criteria lead to rejection of a statistically stable mean.
 .
.
(Essay)
4.8/5  (35)
(35)
Which of the following terms is sometimes used instead of "non-parametric test"?
(Multiple Choice)
4.8/5 (35)
Use the Minitab display to test the indicated claim. A manager records the production output of
three employees who each work on three different machines for three different days. The
sample results are given below and the Minitab results follow. Employee I 31,34,32 29,23,22 21,20,24 Machine II 19,26,22 35,33,30 25,19,23 III 21,18,26 20,23,24 36,37,31
SOURCE DF SS MS MACHINE 2 1.19 .59 EMPLOYEE 2 5.85 2.93 INTERACTION 4 710.81 177.70 ERROR 18 160.00 8.89 TOTAL 26 877.85 Assume that the number of items produced is not affected by an interaction between
employee and machine. Using a 0.05 significance level, test the claim that the choice of
employee has no effect on the number of items produced.
(Essay)
5.0/5 (39)
Explain the procedure for two-way analysis of variance varies depending on whether there is
an interaction between the two factors or not.
(Essay)
4.9/5 (33)
Identify the value of the test statistic. Source DF SS MS F p Factor 3 30 10.00 1.6 0.264 Error 8 50 6.25 Total 11 80
(Multiple Choice)
4.8/5 (33)
Use the runs test to determine whether the given sequence is random. Use a significance level
of 0.05. Test the sequence of digits below for randomness above and below the value of 4.5. 0 4 7 3 6 0 9 7 4 8 7 2 8 5 7 3 9 6 4 6 4 7 9 1 6 1 9 5 8 3 7 8 5 7 3 5 2 9 3 8
(Essay)
4.8/5 (36)
A teacher uses two different CAI programs to remediate a randomly selected group of
students. Results for two independent samples on a standardized test are listed in a table
below. At the 0.05 level of significance, use the Wilcoxon rank-sum test to test the hypothesis
that the sample results are from populations with equal medians.
60 75 61 63 66 89 68 77 86 69 64 70 84 80 81 87 72 82 59 78 73 91 93 94 95
(Essay)
4.8/5 (34)
A control chart for is shown below. Determine whether the process mean is within statistical control. If it is not, identify which of the three out-of-control criteria lead to rejection of a statistically stable mean.
(Essay)
4.9/5 (38)
Describe the rank correlation test. What types of hypotheses is it used to test? How does the
rank correlation coefficient differ from the Pearson correlation coefficient r?
(Essay)
4.7/5 (40)
__________________ variation results from causes that can be identified.
(Multiple Choice)
4.8/5 (32)
Use the runs test to determine whether the given sequence is random. Use a significance level
of 0.05. A true-false test had the following answer sequence.
Test the null hypothesis that the sequence was random.
(Essay)
4.9/5 (36)
Use the Minitab display to test the indicated claim. A manager records the production output of three employees who each work on three different machines for three different days. The
Sample results are given below and the Minitab results follow. Employee I 16,18,19 15,17,20 14,18,16 Machine II 20,27,29 25,28,27 29,28,26 III 15,18,17 16,16,19 13,17,16
SOURCE DF SS MS MACHINE 2 588.74 294.37 EMPLOYEE 2 2.07 1.04 INTERACTION 4 15.48 3.87 ERROR 18 98.67 5.48 TOTAL 26 704.96 Using a 0.05 significance level, test the claim that the interaction between employee and
Machine has no effect on the number of items produced. State your conclusion about the null
Hypothesis and the claim.
(Multiple Choice)
4.9/5 (39)
Use the Minitab display to test the indicated claim. A manager records the production output of
three employees who each work on three different machines for three different days. The
sample results are given below and the Minitab results follow. Employee I 31,34,32 29,23,22 21,20,24 Machine II 19,26,22 35,33,30 25,19,23 III 21,18,26 20,23,24 36,37,31
SOURCE DF SS MS MACHINE 2 1.19 .59 EMPLOYEE 2 5.85 2.93 INTERACTION 4 710.81 177.70 ERROR 18 160.00 8.89 TOTAL 26 877.85 Using a 0.05 significance level, test the claim that the interaction between employee and
machine has no effect on the number of items produced.
(Essay)
4.7/5 (42)
The following data shows annual income, in thousands of dollars, categorized according to the
two factors of gender and level of education. Assume that incomes are not affected by an
interaction between gender and level of education, and test the null hypothesis that level of
education has no effect on income. Use a 0.05 significance level. Female Male High school 23,27,24,26 25,26,22,24 College 28,36,31,33 35,32,39,28 Advanced degree 41,38,43,49 35,50,47,44
(Essay)
4.9/5 (38)
Examine the given run chart or control chart and determine whether the process is within
statistical control. If it is not, identify which of the three out-of-statistical-control criteria apply. 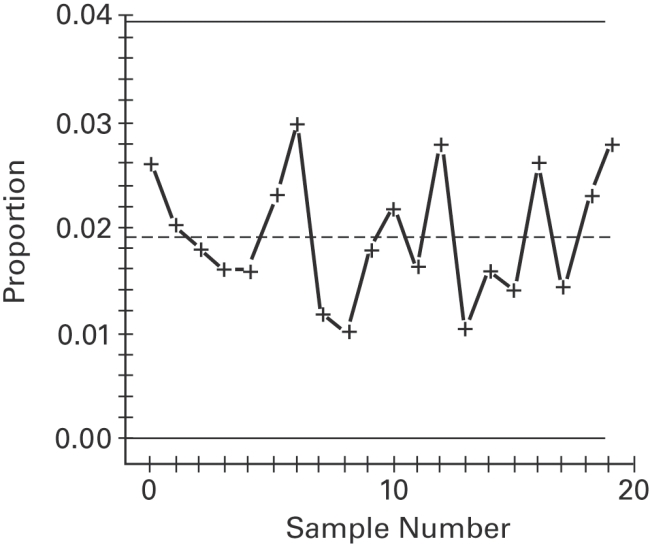
(Essay)
4.9/5 (36)
Define statistically stable (or "within statistical control"). Show examples of run charts which
illustrate processes which are not statistically controlled. Discuss the pattern which indicates
the process is not statistically controlled for each example.
(Essay)
5.0/5 (43)
What is the corresponding parametric test for the Kruskal-Wallis test?
(Multiple Choice)
4.7/5 (31)
Examine the given run chart or control chart and determine whether the process is within statistical control. 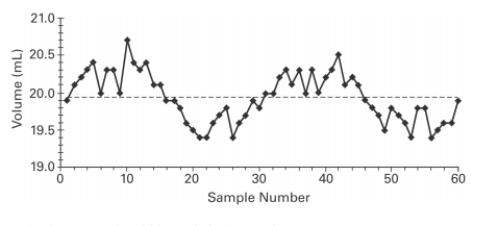
(Multiple Choice)
4.9/5 (34)
Filters
- Essay(0)
- Multiple Choice(0)
- Short Answer(0)
- True False(0)
- Matching(0)