Exam 12: Control Charts and Process Monitoring
Exam 1: Introduction to Statistics60 Questions
Exam 2: Exploring Data With Tables and Graphs60 Questions
Exam 3: Describing, Exploring, and Comparing Data60 Questions
Exam 4: Probability60 Questions
Exam 5: Discrete Probability Distributions59 Questions
Exam 6: Normal Probability Distributions58 Questions
Exam 7: Estimating Parameters and Determining Sample Sizes60 Questions
Exam 8: Hypothesis Testing60 Questions
Exam 9: Inferences From Two Samples60 Questions
Exam 10: Correlation and Regression60 Questions
Exam 11: Chi-Square and Analysis of Variance60 Questions
Exam 12: Control Charts and Process Monitoring178 Questions
Select questions type
Construct an R chart and determine whether the process variation is within statistical control.
n 2 1.880 2.659 0.000 3.267 0.000 3.267 3 1.023 1.954 0.000 2.568 0.000 2.574 4 0.729 1.628 0.000 2.266 0.000 2.282 5 0.577 1.427 0.000 2.089 0.000 2.114 6 0.483 1.287 0.030 1.970 0.000 2.004 7 0.419 1.182 0.118 1.882 0.076 1.924 8 0.373 1.099 0.185 1.815 0.136 1.864 9 0.337 1.032 0.239 1.761 0.184 1.816 10 0.308 0.975 0.284 1.716 0.223 1.777
A machine is supposed to fill cans that contain 12 ounces. Each hour, a sample of four cans is tested; the results of 15 consecutive hours are given below.
1 11.2 11.7 11.8 11.7 11.600 0.6 2 11.8 11.3 11.6 11.6 11.575 0.5 3 11.3 12.0 11.8 11.7 11.700 0.7 4 12.1 11.6 12.1 12.0 11.950 0.5 5 11.8 11.8 11.9 11.9 11.850 0.1 6 12.0 11.9 11.8 11.7 11.850 0.3 7 11.6 12.0 11.9 11.8 11.825 0.4 8 11.5 12.1 11.9 12.0 11.875 0.6 9 12.1 12.1 11.7 11.9 11.950 0.4 10 11.7 12.0 11.6 11.9 11.800 0.4 11 12.1 12.4 11.9 12.2 12.150 0.5 12 12.5 12.0 12.4 12.3 12.300 0.5 13 12.5 12.0 12.1 12.1 12.175 0.5 14 12.4 12.0 12.0 12.4 12.200 0.4 15 12.4 12.4 12.6 12.1 12.375 0.5
(Essay)
4.8/5  (43)
(43)
A machine that is supposed to fill small bottles to contain 20 milliliters yields the following data from a test of 4 bottles every hour. What would be the centerline for a control chart for ?
Sample Range 1 19.9 20.1 20.2 20.3 20.125 0.4 2 20.4 20.0 20.3 20.3 20.250 0.4 3 20.0 20.7 20.4 20.3 20.350 0.7 4 20.4 20.1 20.1 19.9 20.125 0.5 5 19.9 19.8 19.6 19.5 19.700 0.4 6 19.4 19.4 19.6 19.7 19.525 0.3 7 19.8 19.4 19.6 19.7 19.625 0.4 8 19.9 19.8 20.0 20.0 19.925 0.2 9 20.2 20.3 20.1 20.3 20.225 0.2 10 20.0 20.3 20.0 20.2 20.125 0.3 11 20.3 20.5 20.1 20.2 20.275 0.4 12 20.1 19.9 19.8 19.7 19.875 0.4 13 19.5 19.8 19.7 19.6 19.650 0.3 14 19.4 19.8 19.8 19.4 19.400 0.4 15 19.5 19.6 19.6 19.9 19.650 0.4
(Multiple Choice)
4.9/5 (35)
Use the rank correlation coefficient to test for a correlation between the two variables. Use the
sample data below to find the rank correlation coefficient and test the claim of correlation
between math and verbal scores. Use a significance level of 0.05. Mathematics 347 440 327 456 427 349 377 398 425 Verbal 285 378 243 371 340 271 294 322 385
(Essay)
4.9/5 (40)
Provide an appropriate response. Describe what process data are. Why are process data
important to businesses? What is a common goal of businesses using quality control?
(Essay)
4.8/5 (45)
If the critical values for a run test (found from table A-10)are 8 and 19 and the G value is 17, what should your conclusion about randomness be?
(Multiple Choice)
4.7/5 (31)
A control chart for is shown below. Determine whether the process variation is within statistical control. If it is not, identify which of the three out-of-control criteria lead to rejection of statistically stable variation.
(Essay)
4.9/5 (33)
Describe the sign test. What types of hypotheses is it used to test? What is the underlying
concept?
(Essay)
4.8/5 (39)
Find the critical value. Assume that the test is two-tailed and that denotes the number of pairs of data.
(Multiple Choice)
4.9/5 (46)
Given below are the analysis of variance results from a Minitab display. to use a 0.05 significance level in testing the null hypothesis that the different samples come
From populations with the same mean. Identify the p-value. Source Factor 3 30 10.00 1.6 0.264 Error 8 50 6.25 Total 11 80
(Multiple Choice)
4.8/5 (36)
Given below are the analysis of variance results from a Minitab display. to use a 0.05 significance level in testing the null hypothesis that the different samples come
From populations with the same mean. Identify the P-value. Source Factor 3 13.500 4.500 5.17 0.011 Error 16 13.925 0.870 Total 19 27.425
(Multiple Choice)
4.8/5 (34)
Match the parametric test with its related nonparametric test.
Analysis of variance ( test)
(Multiple Choice)
4.7/5 (28)
Use the given process data to construct a control chart for p. A manufacturer monitors the level of defects in the television sets that it produces. Each week, 200 television sets are randomly selected and tested and the number of defects is recorded. The results for 12 consecutive weeks are shown below.
4 7 5 6 8 3 12 4 4 5 6 2
(Essay)
4.8/5 (27)
Select an appropriate null hypothesis for a one way analysis of variance test.
(Multiple Choice)
4.9/5 (34)
Examine the given run chart or control chart and determine whether the process is within
statistical control. If it is not, identify which of the three out-of-statistical-control criteria apply. 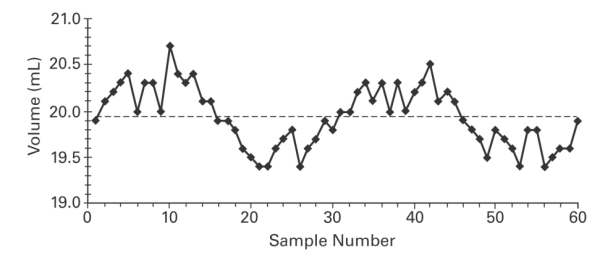 x is shown below. Determine whether the process mean is within statistical
(Essay)
4.8/5 (40)
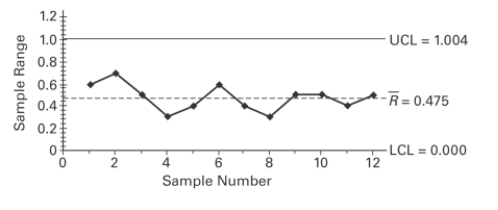
A control chart for R is shown below. Determine whether the process variation is within
statistical control. If it is not, identify which of the three out-of-control criteria lead to rejection
of statistically stable variation. 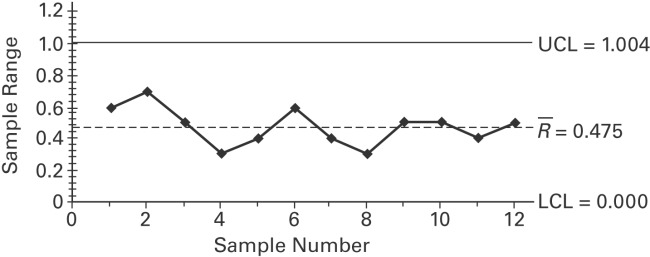
(Essay)
4.9/5 (38)
Given below are the analysis of variance results from a Minitab display. to use a 0.05 significance level in testing the null hypothesis that the different samples come
From populations with the same mean. What can you conclude about the equality of the
Population means? Source Factor 3 13.500 4.500 5.17 0.011 Error 16 13.925 0.870 Total 19 27.425
(Multiple Choice)
4.8/5 (27)
Find the ranks corresponding to the ages of five statistics professors when they were hired? 47, 51, 47, 47, 48
(Multiple Choice)
4.9/5 (38)
Given below are the analysis of variance results from a Minitab display. to use a 0.05 significance level in testing the null hypothesis that the different samples come
From populations with the same mean. Identify the P-value. Source DF SS MS F Factor 3 30 10.00 1.6 0.264 Error 8 50 6.25 Total 11 80
(Multiple Choice)
4.9/5 (31)
At the same time each day, a researcher records the temperature in each of three greenhouses?
The table shows the temperatures in degrees Fahrenheit recorded for one week. Greenhouse \#1 Greenhouse \#2 Greenhouse \#3 73 71 67 72 69 63 73 72 62 66 72 61 68 65 60 71 73 62 72 71 59 i)Use a 0.05 significance level to test the claim that the average temperature is the same in
each greenhouse.
ii)How are the analysis of variance results affected if the same constant is added to every
one of the original sample values?
(Essay)
4.8/5 (34)
Filters
- Essay(0)
- Multiple Choice(0)
- Short Answer(0)
- True False(0)
- Matching(0)