Exam 7: Introduction to Sampling Distributions
Exam 1: The Where, Why, and How of Data Collection167 Questions
Exam 2: Graphs, Charts and Tablesdescribing Your Data138 Questions
Exam 3: Describing Data Using Numerical Measures138 Questions
Exam 4: Introduction to Probability125 Questions
Exam 5: Discrete Probability Distributions161 Questions
Exam 6: Introduction to Continuous Probability Distributions122 Questions
Exam 7: Introduction to Sampling Distributions136 Questions
Exam 8: Estimating Single Population Parameters174 Questions
Exam 9: Introduction to Hypothesis Testing183 Questions
Exam 10: Estimation and Hypothesis Testing for Two Population Parameters121 Questions
Exam 11: Hypothesis Tests and Estimation for Population Variances69 Questions
Exam 12: Analysis of Variance162 Questions
Exam 13: Goodness-Of-Fit Tests and Contingency Analysis105 Questions
Exam 14: Introduction to Linear Regression and Correlation Analysis139 Questions
Exam 15: Multiple Regression Analysis and Model Building148 Questions
Exam 16: Analyzing and Forecasting Time-Series Data131 Questions
Exam 17: Introduction to Nonparametric Statistics103 Questions
Exam 18: Introducing Business Analytics48 Questions
Exam 19: Introduction to Decision Analysis48 Questions
Exam 20: Introduction to Quality and Statistical Process Control42 Questions
Select questions type
If a population is normally distributed, then the sampling distribution for the sample mean will always be normally distributed regardless of the sample size.
(True/False)
4.9/5  (25)
(25)
The makers of a particular type of candy have stated that 75 percent of their sacks of candy will contain 6 ounces or more of candy. A consumer group that studies such claims recently selected a random sample of 100 sacks of this candy. Of these, 70 sacks actually contained 6 ounces or more. The probability that 70 or fewer sacks would contain 6 ounces or less is approximately 0.1251.
(True/False)
4.9/5 (33)
The monthly electrical utility bills of all customers for the Far East Power and Light Company are known to be distributed as a normal distribution with mean equal to $87.00 a month and standard deviation of $36.00. If a statistical sample of n = 100 customers is selected at random, what is the probability that the mean bill for those sampled will exceed $75.00?
(Multiple Choice)
4.9/5 (33)
According to the local real estate board, the average number of days that homes stay on the market before selling is 78.4 with a standard deviation equal to 11 days. A prospective seller selected a random sample of 36 homes from the multiple listing service. Above what value for the sample mean should 95 percent of all possible sample means fall?
(Multiple Choice)
4.8/5 (33)
A major automobile manufacturer has developed a new model car that it claims will average 25 mpg on the highway. A random sample of fifty of these cars was tested and they averaged 24 mpg. This means that the claim made by the auto company is incorrect.
(True/False)
4.9/5 (39)
The annual income for independent sales representatives in the United States is thought to be highly right-skewed with a mean equal to $144,300 and a standard deviation of $32,450. Given this information, if a sample of 36 independent sales representatives is selected, what is the probability that the mean of the sample will exceed $130,000?
(Essay)
4.8/5 (32)
A sampling distribution for a sample mean shows the distribution of the possible values for the sample mean for a given sample size from a population.
(True/False)
4.9/5 (27)
A local bank has 1,400 checking account customers. Of these, 1,020 also have savings accounts. A sample of 400 checking account customers was selected from the bank of which 302 also had savings accounts. The sampling error in this situation is .0264.
(True/False)
4.8/5 (29)
The following values represent the population of home mortgage interest rates (in percents) being charged by the banks in a particular city: 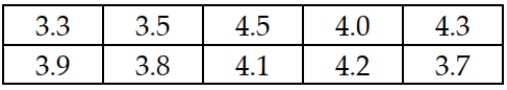 Given this information, what is the smallest amount of sampling error possible if a random sample of n = 3 banks is surveyed and the mean loan rate is calculated?
(Multiple Choice)
4.8/5 (34)
The actual mean fill volume for all bottles of a soft drink product that were filled on a Tuesday is 11.998 ounces. A sample of 64 bottles was randomly selected and the sample mean fill volume was 12.004 ounces. Based upon this information, the sampling error is .006 ounce.
(True/False)
4.8/5 (32)
Suppose it is known that the ages of all employees working for a very large computer company is normally distributed with a mean of 44.2 and a standard deviation of 5.6 years. Given this information, discuss what the sampling distribution for looks like?
(Essay)
4.7/5 (40)
If the mean age for all students that attend your university is 24.78 years, it would be reasonable to expect that the mean of a sample of students selected from that population would also equal 24.78 years as long at the sampling is done using sound statistical methods.
(True/False)
4.7/5 (33)
Princess Cruises recently offered a 16-day voyage from Beijing to Bangkok during the time period from May to August. The announced price, excluding airfare, for a room with an ocean view or a balcony was listed as $3,475. Cruise fares usually are quite variable due to discounting by the cruise line and travel agents. A sample of 20 passengers who purchased this cruise paid the following amounts (in dollars): 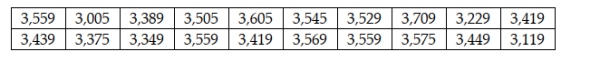 Determine the sampling error for this sample.
(Multiple Choice)
4.8/5 (35)
The St. Joe Company grows pine trees and the average annual increase in tree diameter is 3.1 inches with a standard deviation of 0.5 inch. A random sample of n = 50 trees is collected. What is the probability of the sample mean being less the 2.9 inches?
(Multiple Choice)
4.8/5 (39)
A population has a proportion equal to 0.30. Calculate the following probabilities with n = 100. Find
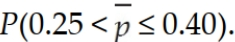
(Multiple Choice)
5.0/5 (33)
Explain the impact of the size of the sample on the shape of the sampling distribution.
(Essay)
4.8/5 (34)
The population of incomes in a particular community is thought to be highly right-skewed with a mean equal to $36,789 and a standard deviation equal to $2,490. Based on this, if a sample of size n = 36 is selected, the highest sample mean that we would expect to see would be approximately $38,034.
(True/False)
4.8/5 (32)
The Olsen Agricultural Company has determined that the weight of hay bales is normally distributed with a mean equal to 80 pounds and a standard deviation equal to 8 pounds. Based on this, what is the probability that the mean weight of the bales in a sample of n = 64 bales will be between 78 and 82 pounds?
(Multiple Choice)
4.9/5 (33)
The Central Limit Theorem is of most use to decision makers when the population is known to be normally distributed.
(True/False)
4.8/5 (34)
Suppose nine items are randomly sampled from a normally distributed population with a mean of 100 and a standard deviation of 20. The nine randomly sampled values are: 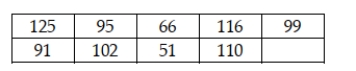 Calculate the probability of getting a sample mean that is smaller than the sample mean for these nine sampled values.
(Multiple Choice)
4.8/5 (36)
Filters
- Essay(0)
- Multiple Choice(0)
- Short Answer(0)
- True False(0)
- Matching(0)