Exam 14: Introduction to Linear Regression and Correlation Analysis
Exam 1: The Where, Why, and How of Data Collection167 Questions
Exam 2: Graphs, Charts and Tablesdescribing Your Data138 Questions
Exam 3: Describing Data Using Numerical Measures138 Questions
Exam 4: Introduction to Probability125 Questions
Exam 5: Discrete Probability Distributions161 Questions
Exam 6: Introduction to Continuous Probability Distributions122 Questions
Exam 7: Introduction to Sampling Distributions136 Questions
Exam 8: Estimating Single Population Parameters174 Questions
Exam 9: Introduction to Hypothesis Testing183 Questions
Exam 10: Estimation and Hypothesis Testing for Two Population Parameters121 Questions
Exam 11: Hypothesis Tests and Estimation for Population Variances69 Questions
Exam 12: Analysis of Variance162 Questions
Exam 13: Goodness-Of-Fit Tests and Contingency Analysis105 Questions
Exam 14: Introduction to Linear Regression and Correlation Analysis139 Questions
Exam 15: Multiple Regression Analysis and Model Building148 Questions
Exam 16: Analyzing and Forecasting Time-Series Data131 Questions
Exam 17: Introduction to Nonparametric Statistics103 Questions
Exam 18: Introducing Business Analytics48 Questions
Exam 19: Introduction to Decision Analysis48 Questions
Exam 20: Introduction to Quality and Statistical Process Control42 Questions
Select questions type
If a sample of n = 30 people is selected and the sample correlation between two variables is r = 0.468, what is the test statistic value for testing whether the true population correlation coefficient is equal to zero?
Free
(Multiple Choice)
4.8/5  (38)
(38)
Correct Answer: Verified
A
A regression model that is deemed to have a regression slope coefficient that could be equal to zero should not be used for prediction since there is no established linear relationship between the x and y variable.
Free
(True/False)
4.7/5 (33)
Correct Answer:Verified
True
A recent study by a major financial investment company was interested in determining whether the annual percentage change in stock price for companies is linearly related to the annual percent change in profits for the company. The following data was determined for 7 randomly selected companies: 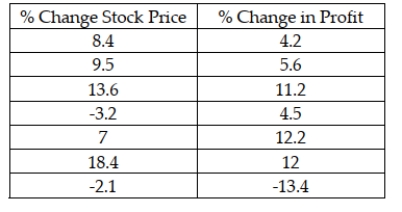 Based upon this sample information, what portion of variation in stock price percentage change is explained by the percent change in yearly profit?
Free
(Multiple Choice)
4.9/5 (40)
Correct Answer:Verified
C
If the correlation of x and y is -0.65, then coefficient of determination is -0.4225.
(True/False)
4.9/5 (31)
Use the following regression results to answer the question below. 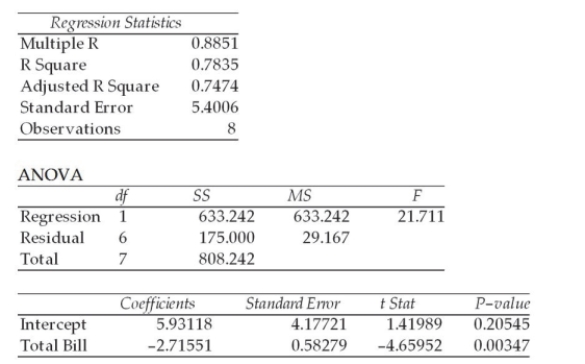 Which of the following is true?
(Multiple Choice)
4.9/5 (33)
A dependent variable is the variable that we wish to predict or explain in a regression model.
(True/False)
4.7/5 (36)
The following regression output is available. Notice that some of the values are missing. 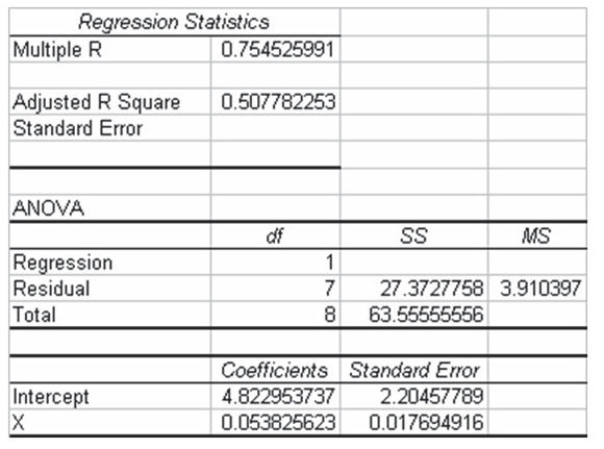 Given this information, what was the sample size used in the study?
(Multiple Choice)
4.8/5 (29)
In a regression analysis situation, the standard error of the slope is:
(Multiple Choice)
4.7/5 (40)
A health insurance company conducted a linear regression analysis between the number of claims per customer (Y) and customer age (X) that resulted in the following equation analyzing customer risk:  The above equation implies that an
(Multiple Choice)
4.9/5 (27)
The following regression output was generated based on a sample of utility customers. The dependent variable was the dollar amount of the monthly bill and the independent variable was the size of the house in square feet. 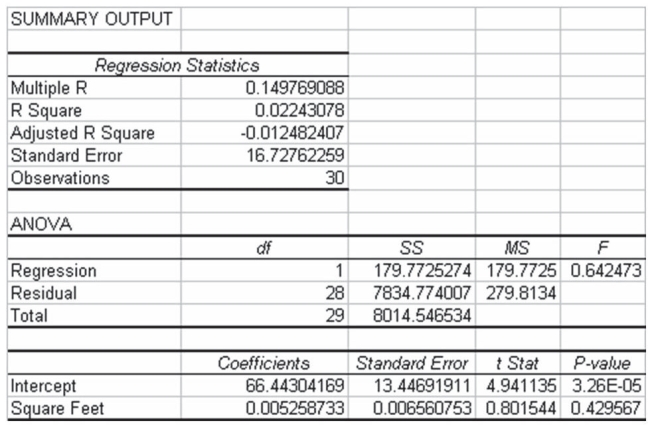 Based on this regression output, which of the following statements is not true?
(Multiple Choice)
4.8/5 (42)
A recent study of 15 shoppers showed that the correlation between the time spent in the store and the dollars spent was 0.235. Using a significance level equal to 0.05, which of the following is the appropriate null hypothesis to test whether the population correlation is zero?
(Multiple Choice)
4.8/5 (29)
Assume that you have calculated a prediction of = 110 where the specific value for x is equal to the average value of x. Also assume that n = 201 and that the standard error of the estimate is sε = 4.5. Find the approximate 95 percent prediction interval.
(Multiple Choice)
4.9/5 (33)
In conducting a hypothesis test for a correlation, the correct probability distribution to use is the F distribution.
(True/False)
4.9/5 (31)
In developing a simple linear regression model it is assumed that the distribution of error terms will be normally distributed for all levels of x.
(True/False)
4.8/5 (25)
If two variables are highly correlated, it not only means that they are linearly related, it also means that a change in one variable will cause a change in the other variable.
(True/False)
4.8/5 (39)
When calculating prediction intervals for predicted values of y based on a given x, all 95 percent prediction intervals will be of equal width.
(True/False)
4.9/5 (34)
State University recently randomly sampled ten students and analyzed grade point average (GPA) and number of hours worked off-campus per week. The following data were observed: 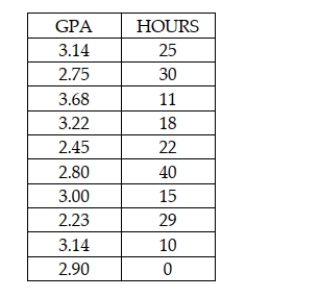 If the university wished to test the claim that the correlation between hours worked and GPA is negative, the following null and alternative hypotheses would be appropriate: H0 : ρ < 0.0 Ha : ρ ≥ 0.0
(True/False)
4.8/5 (34)
State University recently randomly sampled seven students and analyzed grade point average (GPA) and number of hours worked off-campus per week. The following data were observed: 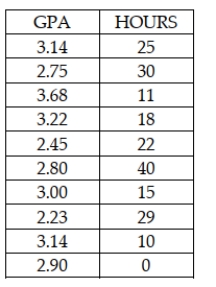 A regression model with HOURS as the independent variable has an R-square equal to approximately .46.
(True/False)
4.8/5 (26)
A scatter plot is useful for identifying a linear relationship between the independent and dependent variable, but it is not particularly useful if the relationship is curvilinear.
(True/False)
5.0/5 (35)
If a pair of variables have a strong curvilinear relationship, which of the following is true?
(Multiple Choice)
4.9/5 (39)
Filters
- Essay(0)
- Multiple Choice(0)
- Short Answer(0)
- True False(0)
- Matching(0)