Exam 16: Analyzing and Forecasting Time-Series Data
Exam 1: The Where, Why, and How of Data Collection167 Questions
Exam 2: Graphs, Charts and Tablesdescribing Your Data138 Questions
Exam 3: Describing Data Using Numerical Measures138 Questions
Exam 4: Introduction to Probability125 Questions
Exam 5: Discrete Probability Distributions161 Questions
Exam 6: Introduction to Continuous Probability Distributions122 Questions
Exam 7: Introduction to Sampling Distributions136 Questions
Exam 8: Estimating Single Population Parameters174 Questions
Exam 9: Introduction to Hypothesis Testing183 Questions
Exam 10: Estimation and Hypothesis Testing for Two Population Parameters121 Questions
Exam 11: Hypothesis Tests and Estimation for Population Variances69 Questions
Exam 12: Analysis of Variance162 Questions
Exam 13: Goodness-Of-Fit Tests and Contingency Analysis105 Questions
Exam 14: Introduction to Linear Regression and Correlation Analysis139 Questions
Exam 15: Multiple Regression Analysis and Model Building148 Questions
Exam 16: Analyzing and Forecasting Time-Series Data131 Questions
Exam 17: Introduction to Nonparametric Statistics103 Questions
Exam 18: Introducing Business Analytics48 Questions
Exam 19: Introduction to Decision Analysis48 Questions
Exam 20: Introduction to Quality and Statistical Process Control42 Questions
Select questions type
If the observed value in a time series for period 3 is yt = 128, and the seasonal index that applies to period 3 is 1.20, then the deseasonalized value for period 3 is 153.6
Free
(True/False)
4.8/5  (30)
(30)
Correct Answer: Verified
False
The Gilbert Company chief financial officer has been tracking annual sales for each of the company's three divisions for the past 10 years. At a recent meeting, he pointed to the annual data and indicated that it clearly showed the seasonality associated with its business. Given the data, this statement may have been very appropriate.
Free
(True/False)
4.8/5 (25)
Correct Answer:Verified
False
If a time series involves monthly data there will be a total of 12 seasonal indexes.
Free
(True/False)
4.8/5 (37)
Correct Answer:Verified
True
The Boxer Company has been in business since 1998. The following sales data are recorded by quarter for the years 2010-2012. 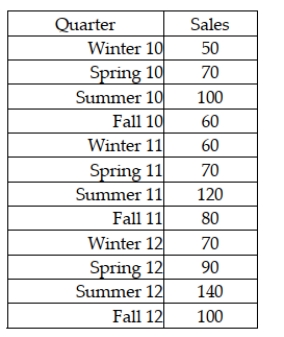 The managers at the company wish to determine the seasonal indexes for each quarter during the year. The first step in the process is to remove the seasonal and random components. To do this, they will begin by computing a four period moving average. What is the four-period moving average based on Winter 99 - Fall 99?
(Multiple Choice)
5.0/5 (37)
In a single exponential smoothing model, finding the forecast value for each period requires having the actual and forecasted values from the proceeding period. The first period should use an estimated average value based on previous estimates.
(True/False)
4.8/5 (30)
It is possible to use linear regression analysis to develop a forecasting model for nonlinear data if we can effectively transform the data.
(True/False)
4.8/5 (41)
The Boxer Company has been in business since 1998. The following sales data are recorded by quarter for the years 2010-2012. 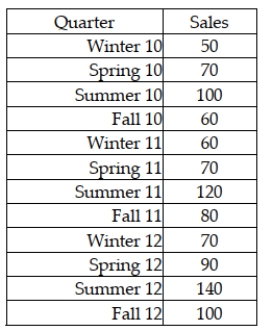 Which of the following time-series components are present in these data?
(Multiple Choice)
4.9/5 (31)
The Zocor Company is interested in forecasting period 13 sales for a product. It has 12 months of historical data. The following shows the data and the forecasted values for periods 1-12 using a single exponential smoothing model with a smoothing constant value equal to 0.20 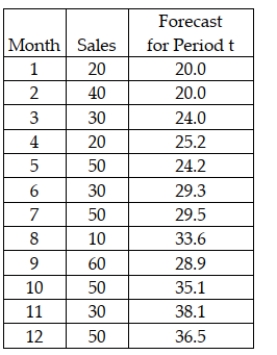 What is the forecast bias value for the model over periods 2-12?
(Multiple Choice)
4.8/5 (35)
The owners of Hal's Cookie Company have collected sales data for the past 8 months. These data are shown as follows: 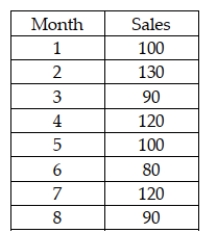 Using a smoothing constant of 0.4, the forecast value for period 3 is 112.
(True/False)
4.9/5 (25)
Suppose an economist has developed a model for forecasting annual consumption, yt, as function of total labor income, x1t , and total property income, x2t based on 20 years on annual data. The following regression model has been developed: t = 7.81 + 0.91x1t + 0.57x2t with the standard error = 1.29 and the Durbin-Watson d statistic = 2.09. Using an alpha = .05, which of the following conclusions should be reached?
(Multiple Choice)
4.7/5 (31)
Renton Industries makes replacement parts for the automobile industry. As part of the company's capacity planning, it needs a long-range total demand forecast. The following information was generated based on 10 years of historical data on total number of parts sold each year. 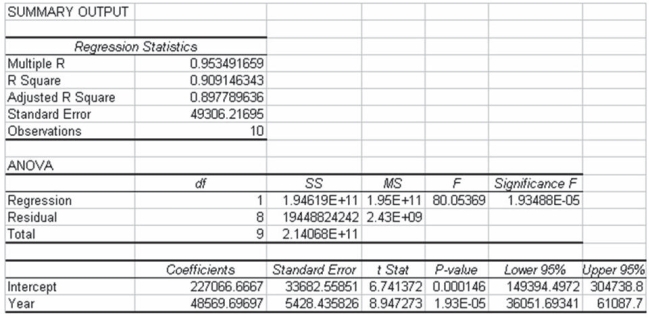 Based on this information, we can conclude that sales on average have been growing by more than 48 thousand annually.
(True/False)
4.8/5 (35)
Gibson, Inc. is a holding company that owns several businesses. One such business is a truck sales company. To help in managing this operation, managers at Gibson have collected sales data for the past 20 years showing the number of trucks sold each year. They have then developed the linear trend forecasting model shown as follows: 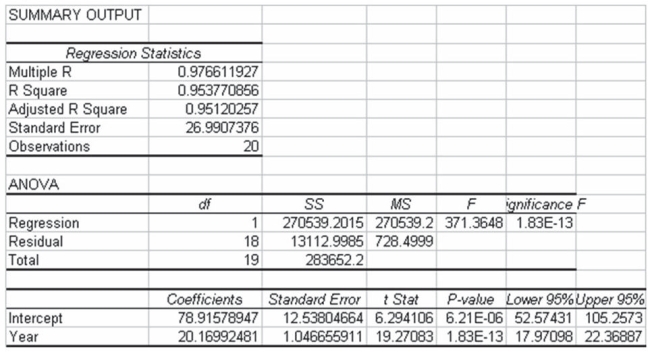 Based on this information, it appears that the time series has a strong positive linear trend component.
(True/False)
4.8/5 (34)
Which of the following time-series components is almost always present in sales data for electronics companies?
(Multiple Choice)
5.0/5 (32)
Herb Criner, an analyst for the Folgerty Company, recently gave a report in which he stated that the annual sales forecast based on 20 years of annual sales data was done using a seasonally adjusted, trend- based forecasting technique. Given the information presented here, this statement has the potential to be credible.
(True/False)
4.8/5 (38)
A time-series plot that exhibits a general increase in value from the early periods to the latest time periods:
(Multiple Choice)
4.9/5 (24)
If you suspect that your trend forecasting model may have autocorrelated forecast errors, which the following should you compute?
(Multiple Choice)
4.7/5 (25)
In a single exponential smoothing model, a large value for the smoothing constant will result in greater smoothing of the data than will a smoothing constant close to zero.
(True/False)
4.7/5 (35)
The Baker's Candy Company has been in business for three years. The quarterly sales data for the company are shown as follows: 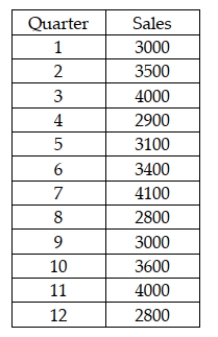 As a first step in computing a seasonal index, the four-period moving average corresponding to the mid- point between periods 2 and 3 is 3,350.
(True/False)
4.9/5 (29)
In measuring forecast errors, the MAD and the square root of the MSE will provide similar (but not identical) values, in that both provide a measure of the "typical" amount of error in forecasts.
(True/False)
4.9/5 (32)
If you suspect that a nonlinear trend exists in your data, one way to deal with it in a trend-based forecasting application is to transform the independent variable, for example by squaring the time measure or maybe taking the square-root of the time measure.
(True/False)
4.9/5 (37)
Filters
- Essay(0)
- Multiple Choice(0)
- Short Answer(0)
- True False(0)
- Matching(0)