Exam 8: Estimating Single Population Parameters
Exam 1: The Where, Why, and How of Data Collection167 Questions
Exam 2: Graphs, Charts and Tablesdescribing Your Data138 Questions
Exam 3: Describing Data Using Numerical Measures138 Questions
Exam 4: Introduction to Probability125 Questions
Exam 5: Discrete Probability Distributions161 Questions
Exam 6: Introduction to Continuous Probability Distributions122 Questions
Exam 7: Introduction to Sampling Distributions136 Questions
Exam 8: Estimating Single Population Parameters174 Questions
Exam 9: Introduction to Hypothesis Testing183 Questions
Exam 10: Estimation and Hypothesis Testing for Two Population Parameters121 Questions
Exam 11: Hypothesis Tests and Estimation for Population Variances69 Questions
Exam 12: Analysis of Variance162 Questions
Exam 13: Goodness-Of-Fit Tests and Contingency Analysis105 Questions
Exam 14: Introduction to Linear Regression and Correlation Analysis139 Questions
Exam 15: Multiple Regression Analysis and Model Building148 Questions
Exam 16: Analyzing and Forecasting Time-Series Data131 Questions
Exam 17: Introduction to Nonparametric Statistics103 Questions
Exam 18: Introducing Business Analytics48 Questions
Exam 19: Introduction to Decision Analysis48 Questions
Exam 20: Introduction to Quality and Statistical Process Control42 Questions
Select questions type
Recently, a report in a financial journal indicated that the 90 percent confidence interval estimate for the proportion of investors who own one or more mutual funds is between 0.88 and 0.92. Given this information, the sample size that was used in this study was approximately 609 investors.
(True/False)
4.8/5  (26)
(26)
Chicago Connection, a local pizza company, delivers pizzas for free within the market area. The delivery drivers are paid $2.00 per delivery plus they get to keep any tips. To estimate the proportion of deliveries that result in a tip to the driver, a random sample of 64 deliveries was selected. Of these, 48 times a tip was received. Based on this information, and using a 95 percent confidence level, the upper limit for the confidence interval estimate is about .1061.
(True/False)
4.8/5 (43)
At issue is the proportion of people in a particular county who do not have health care insurance coverage. A simple random sample of 240 people was asked if they have insurance coverage, and 66 replied that they did not have coverage. Based on these sample data, determine the 95% confidence interval estimate for the population proportion.
(Multiple Choice)
4.9/5 (41)
Which of the following will increase the width of a confidence interval (assuming that everything else remains constant)?
(Multiple Choice)
4.9/5 (32)
A random sample of 100 boxes of cereal had a sample mean weight of 396 grams. The standard deviation is known to be 5 grams. The upper end of the confidence interval for the mean is 405.8 grams.
(True/False)
4.9/5 (34)
In estimating a population proportion, the factors that are needed to determine the required sample size are the confidence level, the margin of error and some idea of what the population proportion is.
(True/False)
4.8/5 (32)
A 95 percent confidence interval estimate will have a margin of error that is approximately ±47.5 percent of the size of the population mean.
(True/False)
4.9/5 (38)
When determining the sample size for a proportion, if you have no previous information available to estimate p, then the best value to use is π = 0.5.
(True/False)
4.8/5 (29)
A higher confidence level means that the point estimate for the population mean will be closer to the true population mean.
(True/False)
4.8/5 (34)
The chamber of commerce in a beach resort town wants to estimate the proportion of visitors who are repeat visitors. From previous experience they believe the portion is not larger than 20 percent. They want to estimate the proportion to within ± 0.04 percentage points with 95 percent confidence. The sample size they should use is:
(Multiple Choice)
4.8/5 (44)
A random sample of 340 people in Chicago showed that 66 listened to WJKT-1450, a radio station in South Chicago Heights. Based on this information, what is the upper limit for the 95 percent confidence interval estimate for the proportion of people in Chicago that listen to WJKT-1450?
(Multiple Choice)
4.8/5 (33)
The chamber of commerce in a beach resort town wants to estimate the proportion of visitors who are repeat visitors. Suppose that they have estimated that they need a sample size of n=16,577 people to achieve a margin of error of ± .01 percentage points with 99 percent confidence, but this is too large a sample size to be practical. How can they reduce the sample size?
(Multiple Choice)
4.9/5 (36)
In developing a confidence interval estimate, the margin of error is directly dependent on the value of the point estimate.
(True/False)
4.9/5 (22)
One of the major oil products companies conducted a study recently to estimate the mean gallons of gasoline purchased by customers per visit to a gasoline station. To do this, a random sample of customers was selected with the following data being recorded that show the gallons of gasoline purchased. 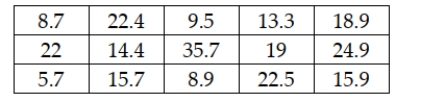 Based on these sample data, construct and interpret a 95 percent confidence interval estimate for the population mean.
(Essay)
4.9/5 (40)
If a decision maker desires a small margin of error and a high level of confidence, it is certain that the required sample size will be quite large.
(True/False)
4.8/5 (30)
In an effort to estimate the mean dollars spent per visit by customers of a food store, the manager has selected a random sample of 100 cash register receipts. The mean of these was $45.67 with a sample standard deviation equal to $12.30. Assuming that he wants to develop a 90 percent confidence interval estimate, which of the following is the margin of error that will be reported?
(Multiple Choice)
4.8/5 (37)
Even before the record gas prices during the summer of 2008, an article written by Will Lester of the Associated Press reported on a poll in which 80% of those surveyed say that Americans who currently own a SUV (sport utility vehicle) should switch to a more fuel-efficient vehicle to ease America's dependency on foreign oil. This study was conducted by the Pew Research Center for the People & the Press. As a follow-up to this report, a consumer group conducted a study of SUV owners to estimate the mean mileage for their vehicles. A simple random sample of 91 SUV owners was selected, and the owners were asked to report their highway mileage. The following results were summarized from the sample data:  Based on these sample data, compute and interpret a 90% confidence interval estimate for the mean highway mileage for SUVs.
(Multiple Choice)
4.7/5 (29)
In discussing a confidence interval estimate for a population mean, is it acceptable to provide an interpretation like the following: "There is a 95 percent chance that μ lies in the range 20 to 40"?
(Essay)
4.9/5 (37)
A survey of 499 women for the American Orthopedic Foot and Ankle Society revealed that 38% wear flats to work. Suppose the society also wishes to estimate the proportion of women who wear athletic shoes to work with a margin of error of 0.01 with 95% confidence. Determine the sample size required.
(Multiple Choice)
4.8/5 (39)
Filters
- Essay(0)
- Multiple Choice(0)
- Short Answer(0)
- True False(0)
- Matching(0)