Exam 13: Goodness-Of-Fit Tests and Contingency Analysis
Exam 1: The Where, Why, and How of Data Collection167 Questions
Exam 2: Graphs, Charts and Tablesdescribing Your Data138 Questions
Exam 3: Describing Data Using Numerical Measures138 Questions
Exam 4: Introduction to Probability125 Questions
Exam 5: Discrete Probability Distributions161 Questions
Exam 6: Introduction to Continuous Probability Distributions122 Questions
Exam 7: Introduction to Sampling Distributions136 Questions
Exam 8: Estimating Single Population Parameters174 Questions
Exam 9: Introduction to Hypothesis Testing183 Questions
Exam 10: Estimation and Hypothesis Testing for Two Population Parameters121 Questions
Exam 11: Hypothesis Tests and Estimation for Population Variances69 Questions
Exam 12: Analysis of Variance162 Questions
Exam 13: Goodness-Of-Fit Tests and Contingency Analysis105 Questions
Exam 14: Introduction to Linear Regression and Correlation Analysis139 Questions
Exam 15: Multiple Regression Analysis and Model Building148 Questions
Exam 16: Analyzing and Forecasting Time-Series Data131 Questions
Exam 17: Introduction to Nonparametric Statistics103 Questions
Exam 18: Introducing Business Analytics48 Questions
Exam 19: Introduction to Decision Analysis48 Questions
Exam 20: Introduction to Quality and Statistical Process Control42 Questions
Select questions type
A lube and oil change business believes that the number of cars that arrive for service is the same each day of the week. If the business is open six days a week (Monday - Saturday) and a random sample of n = 200 customers is selected, the expected number that will arrive on Monday is about 33.33.
(True/False)
4.8/5  (42)
(42)
Recently a survey was conducted involving customers of a fitness center in Dallas, Texas. Participants were asked to indicate how often they use the club by checking one of the following categories: 0-1 time per week; 2-3 times per week; 4-5 times per week; more than 5 times. The following data show how males and females responded to this question. 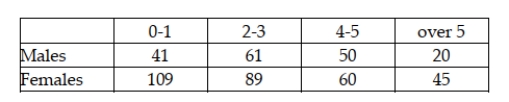 One of the purposes of the survey was to determine whether there is a relationship between the gender of the customer and the number of visits made each week. a. State the appropriate null and alternative hypothesis. b. What test procedure is appropriate to use to conduct this test? c. Conduct the hypothesis test using an alpha = .05 level.
(Essay)
4.7/5 (32)
In a chi-square goodness-of-fit test, by combining cells we guard against having an inflated test statistic that could have caused us to:
(Multiple Choice)
4.9/5 (34)
If the sample size is large, the standard normal distribution can be used in place of the chi-square in a goodness-of-fit test for testing whether the population is normally distributed.
(True/False)
4.9/5 (31)
A sample size of at least 30 is sufficient in most cases provided that none of the expected frequencies are less than 5.
(True/False)
4.7/5 (34)
Managers use contingency analysis to determine whether two categorical variables are independent of each other.
(True/False)
4.9/5 (32)
Contingency analysis helps to make decisions when multiple proportions are involved.
(True/False)
4.9/5 (36)
A lube and oil change business believes that the number of cars that arrive for service is the same each day of the week. If the business is open six days a week (Monday - Saturday) and a random sample of n = 200 customers is selected, the sum of the expected frequencies over the six days cannot be determined without seeing the actual sample data.
(True/False)
4.8/5 (35)
In conducting a test of independence for a contingency table that has 4 rows and 3 columns, the number of degrees of freedom is 11.
(True/False)
4.7/5 (33)
By combining cells we guard against having an inflated test statistic that could have led us to incorrectly accept the null hypothesis.
(True/False)
4.9/5 (36)
A cell phone company wants to determine if the use of text messaging is independent of age. The following data has been collected from a random sample of customers. 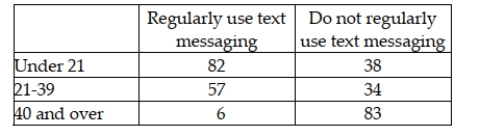 To conduct a contingency analysis using a 0.01 level of significance, the value of the critical value is:
(Multiple Choice)
4.8/5 (23)
In order to apply the chi-square contingency methodology for quantitative variables, we must first break the quantitative variable down into discrete categories.
(True/False)
4.9/5 (38)
We are interested in determining whether the opinions of the individuals on gun control (as to Yes, No, and No Opinion) are uniformly distributed. A sample of 150 was taken and the following data were obtained. 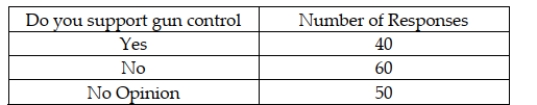 The conclusion of the test with alpha = 0.05 is that the views of people on gun control are:
(Multiple Choice)
4.8/5 (28)
The sampling distribution for a goodness-of-fit test is the Poisson distribution.
(True/False)
4.9/5 (36)
Many companies use well-known celebrities as spokespeople in their TV advertisements. A study was conducted to determine whether brand awareness of female TV viewers and the gender of the spokesperson are independent. Each in a sample of 300 female TV viewers was asked to identify a product advertised by a celebrity spokesperson. The gender of the spokesperson and whether or not the viewer could identify the product was recorded. The numbers in each category are given below. 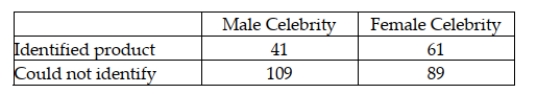 Referring to these sample data, which test would be used to properly analyze the data in this experiment?
(Multiple Choice)
4.8/5 (35)
A study was recently conducted in which people were asked to indicate which news medium was their preferred choice for national news. The following data were observed: 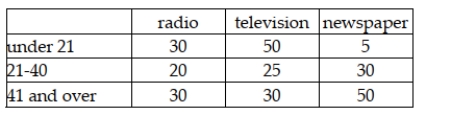 Given this data, if we wish to test whether the preferred news source is independent of age, for an alpha = .05 level, the critical value from the chi-square table is 9.4877.
(True/False)
4.9/5 (40)
If the null hypothesis is not rejected, you do not need to worry when the expected cell frequencies drop below 5.0
(True/False)
4.8/5 (39)
A survey was recently conducted in which males and females were asked whether they owned a laptop personal computer. The following data were observed: 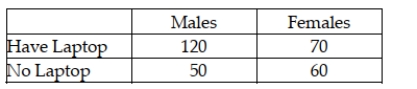 Given this information, if an alpha level of .05 is used, the critical value for testing whether the two variables are independent is x2 = 3.8415.
(True/False)
4.8/5 (33)
A survey was recently conducted in which males and females were asked whether they owned a laptop personal computer. The following data were observed: 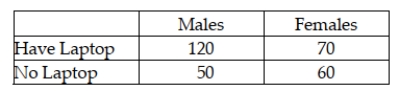 Given this information, if an alpha level of .05 is used, the sum of the expected cell frequencies will be equal to the sum of the observed cell frequencies.
(True/False)
4.7/5 (32)
Filters
- Essay(0)
- Multiple Choice(0)
- Short Answer(0)
- True False(0)
- Matching(0)