Exam 13: Goodness-Of-Fit Tests and Contingency Analysis
Exam 1: The Where, Why, and How of Data Collection167 Questions
Exam 2: Graphs, Charts and Tablesdescribing Your Data138 Questions
Exam 3: Describing Data Using Numerical Measures138 Questions
Exam 4: Introduction to Probability125 Questions
Exam 5: Discrete Probability Distributions161 Questions
Exam 6: Introduction to Continuous Probability Distributions122 Questions
Exam 7: Introduction to Sampling Distributions136 Questions
Exam 8: Estimating Single Population Parameters174 Questions
Exam 9: Introduction to Hypothesis Testing183 Questions
Exam 10: Estimation and Hypothesis Testing for Two Population Parameters121 Questions
Exam 11: Hypothesis Tests and Estimation for Population Variances69 Questions
Exam 12: Analysis of Variance162 Questions
Exam 13: Goodness-Of-Fit Tests and Contingency Analysis105 Questions
Exam 14: Introduction to Linear Regression and Correlation Analysis139 Questions
Exam 15: Multiple Regression Analysis and Model Building148 Questions
Exam 16: Analyzing and Forecasting Time-Series Data131 Questions
Exam 17: Introduction to Nonparametric Statistics103 Questions
Exam 18: Introducing Business Analytics48 Questions
Exam 19: Introduction to Decision Analysis48 Questions
Exam 20: Introduction to Quality and Statistical Process Control42 Questions
Select questions type
It is believed that the number of drivers who are ticketed for speeding on a particular stretch of highway is a Poisson distribution with a mean of 3.5 per hour. A random sample of 100 hours is selected with the following results: 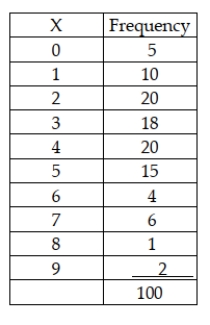 Given this information, it can be seen that the cells will need to be combined since the actual number of occurrences at some levels of x is less than 5.
(True/False)
4.9/5  (38)
(38)
The degrees of freedom for the chi-square goodness-of-fit test are equal to ________, where k is the number of categories.
(Multiple Choice)
4.8/5 (36)
When the expected cell frequencies are smaller than 5, the cells should be combined in a meaningful way such that the expected cell frequencies do exceed 5.
(True/False)
4.9/5 (26)
In a contingency analysis the expected values are based on the assumption that the two variables are independent of each other.
(True/False)
5.0/5 (31)
Unlike the case of goodness-of-fit testing, with contingency analysis there is no restriction on the minimum size for an expected cell frequency.
(True/False)
4.8/5 (30)
Filters
- Essay(0)
- Multiple Choice(0)
- Short Answer(0)
- True False(0)
- Matching(0)