Exam 13: Nonparametric Tests
Exam 1: Introduction to Statistics155 Questions
Exam 2: Exploring Data With Tables and Graphs132 Questions
Exam 3: Describing, Exploring, and Comparing Data225 Questions
Exam 4: Probability219 Questions
Exam 5: Discrete Probability Distributions205 Questions
Exam 6: Normal Probability Distributions254 Questions
Exam 7: Estimating Parameters and Determining Sample Sizes170 Questions
Exam 8: Hypothesis Testing187 Questions
Exam 9: Inferences From Two Samples192 Questions
Exam 10: Correlation and Regression174 Questions
Exam 11: Goodness-Of-Fit and Contingency Tables100 Questions
Exam 12: Analysis of Variance113 Questions
Exam 13: Nonparametric Tests121 Questions
Exam 14: Statistical Process Control90 Questions
Select questions type
Use the runs test to determine whether the given sequence is random. Use a significance level of 0.05. A sample
of 30 clock radios is selected in sequence from an assembly line. Each radio is examined and judged to be
acceptable (A) or defective (D). The results are shown below. Test for randomness.
(Essay)
4.8/5  (41)
(41)
Describe the sign test. What types of hypotheses is it used to test? What is the underlying concept?
(Essay)
4.8/5 (39)
Use the sign test to test the indicated claim. A researcher wishes to test whether a particular diet has an effect on blood pressure. The blood pressure of 24 randomly selected adults is measured. After one month on the diet,
Each person's blood pressure is again measured. For 18 people, the second blood pressure reading was lower
Than the first, and for 6 people, the second blood pressure reading was higher than the first. At the 0.01
Significance level, test the claim that the diet has an effect on blood pressure. What would be the value of the test
Statistic, x?
(Multiple Choice)
4.9/5 (29)
The following scatterplot shows the percentage of the vote a candidate received in the 2004 senatorial elections according to the voter's income level based on an exit poll of voters conducted by CNN. The income levels 1-8 correspond to the following income classes: 1=Under $15,000; 2=$15-30,000; 3=$30-50,000; 4=$50-75,000; 5=$75-100,000; 6=$100-150,000;
7=$150-200,000; 8=$200,000 or more. 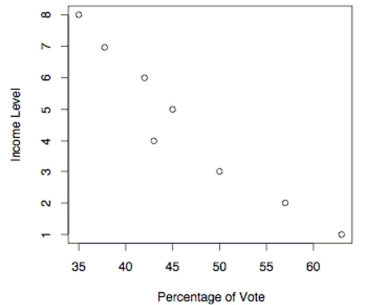 -Use the election scatterplot to determine whether there is a correlation between percentage of vote and income level at the 0.01 significance level with a null hypothesis of
(Multiple Choice)
4.8/5 (32)
Which statement is false about the Wilcoxon signed-ranks test?
(Multiple Choice)
4.9/5 (34)
Use the sign test to test the indicated claim. The heights of 16 randomly selected women are given below. Use a
significance level of 0.05 to test the claim that the population median is equal to 64.0 inches. 62.9 61.9 66.4 68.5 63.7 64.0 65.2 67.0 70.2 65.3 64.0 60.3 64.3 66.9 65.0 63.8
(Essay)
4.8/5 (35)
The table below shows the lifetimes (in hours) of random samples of light bulbs of three different brands. Use a
0.01 significance level to test the claim that the different brands have the same median lifetime. Brand A Brand B Brand C 190 182 203 220 170 210 230 203 199 215 175 200 224 178 196 231 181 197
(Essay)
4.8/5 (37)
Find the critical value. Assume that the test is two-tailed and that denotes the number of pairs of data.
(Multiple Choice)
4.7/5 (40)
Find the ranks corresponding to the ages of five statistics professors when they were hired:
(Multiple Choice)
4.8/5 (36)
Find the critical value. Assume that the test is two-tailed and that n denotes the number of pairs of data.
-Ten luxury cars were ranked according to their comfort levels and their prices. Make Comfort Price A 5 1 B 8 7 C 9 3 D 10 5 E 4 4 F 3 2 G 2 10 H 1 9 I 7 6 6 8 Find the rank correlation coefficient and test the claim of correlation between comfort and price. Use a
significance level of 0.05.
(Essay)
4.8/5 (29)
Use the runs test to determine whether the given sequence is random. Use a significance level of 0.05. A true-false test had the following answer sequence. T T T T F T F T T F T T F T
T T F F F F F F F T F T F T F
Test the null hypothesis that the sequence was random.
(Essay)
4.7/5 (40)
In the sign test procedure the most common approach to handling ties is to exclude the ties. A second approach
is to treat half the 0s (representing ties) as positive signs and half as negative signs. In this approach, if the
number of ties is odd, one tie is excluded so that they can be divided equally. In a sign test for matched pairs
with a claim that the median of the differences is equal to zero, there are 30 positive signs, 50 negative signs, and
23 ties. Identify the test statistic and conclusion for the two different methods. Use a significance level of 0.05.
(Essay)
4.9/5 (34)
11 female employees and 11 male employees are randomly selected from one company and their weekly
salaries are recorded. The salaries (in dollars) are shown below. Use a significance level of 0.10 to test the claim
that the median salary for males and females at the company is the same. 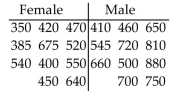
(Essay)
4.8/5 (41)
Find the critical value. Assume that the test is two-tailed and that denotes the number of pairs of data.
(Multiple Choice)
4.9/5 (36)
Use a Kruskal-Wallis test to test the claim that the samples come from populations with equal medians. SAT scores for students selected randomly from three different schools are shown below. Use a significance level of 0.05 to test the claim that the students from the three schools had the same median SAT score. 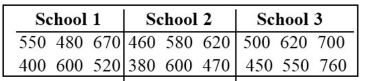 What would be the value of R1 that would be used in finding H?
(Multiple Choice)
4.8/5 (43)
Find the critical value. Assume that the test is two-tailed and that n denotes the number of pairs of data.
-Given that the rank correlation coefficient, r , for 20 pairs of data is 0.547, test the claim of correlation between
the two variables. Use a significance level of 0.05.
(Essay)
4.8/5 (31)
Which of the following distribution-free tests has the lowest efficiency rating compared to its parametric counterpart?
(Multiple Choice)
4.9/5 (36)
Find the critical value. Assume that the test is two-tailed and that n denotes the number of pairs of data.
-Given that the rank correlation coefficient, r for 15 pairs of data is -0.359, test the claim of correlation between
the two variables. Use a significance level of 0.01.
(Essay)
4.9/5 (32)
Which of the following is not an application of the sign test?
(Multiple Choice)
4.8/5 (37)
Filters
- Essay(0)
- Multiple Choice(0)
- Short Answer(0)
- True False(0)
- Matching(0)