Exam 13: Nonparametric Tests
Exam 1: Introduction to Statistics155 Questions
Exam 2: Exploring Data With Tables and Graphs132 Questions
Exam 3: Describing, Exploring, and Comparing Data225 Questions
Exam 4: Probability219 Questions
Exam 5: Discrete Probability Distributions205 Questions
Exam 6: Normal Probability Distributions254 Questions
Exam 7: Estimating Parameters and Determining Sample Sizes170 Questions
Exam 8: Hypothesis Testing187 Questions
Exam 9: Inferences From Two Samples192 Questions
Exam 10: Correlation and Regression174 Questions
Exam 11: Goodness-Of-Fit and Contingency Tables100 Questions
Exam 12: Analysis of Variance113 Questions
Exam 13: Nonparametric Tests121 Questions
Exam 14: Statistical Process Control90 Questions
Select questions type
Use the runs test to determine whether the given sequence is random. Use a significance level of 0.05. Test the
sequence of digits below for randomness above and below the value of 4.5. 0 4 7 3 6 0 9 7 4 8 7 2 8 5 7 3 9 6 4 6 4 7 9 1 6 1 9 5 8 3 7 8 5 7 3 5 2 9 3 8
(Essay)
4.8/5  (40)
(40)
Find the critical value. Assume that the test is two-tailed and that n denotes the number of pairs of data.
-Use the sample data below to find the rank correlation coefficient and test the claim of correlation between math
and verbal scores. Use a significance level of 0.05. Mathematics 347 440 327 456 427 349 377 398 425 Verbal 285 378 243 371 340 271 294 322 385
(Essay)
4.9/5 (43)
Find the critical value. Assume that the test is two-tailed and that n denotes the number of pairs of data.
-A placement test is required for students desiring to take a finite mathematics course at a university. The
instructor of the course studies the relationship between students' placement test score and final course score. A
random sample of eight students yields the following data. 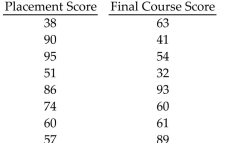 Compute the rank correlation coefficient, of the data and test the claim of correlation between placement score and final course score. Use a significance level of .
(Essay)
4.7/5 (41)
A fire-science specialist tests three different brands of flares for their burning times (in minutes) and the results
are given below for the sample data. At the 0.05 significance level, test the claim that the three different brands
have the same median burn time. Brand X 16.4 17.6 18.3 17.0 17.1 17.3 Brand Y 17.9 18.0 17.8 18.4 17.6 19.0 19.1 Brand Z 17.3 16.4 16.5 16.0 15.8 16.3 17.1
(Essay)
4.9/5 (39)
A researcher wishes to study whether a particular diet is effective in helping people to lose weight. 90 randomly
selected adults were weighed before starting the diet and again after following the diet for one month. 48 people
lost weight, 40 gained weight, and 2 observed no change in their weight. At the 0.01 significance level, test the
claim that the diet is effective.
(Essay)
4.9/5 (41)
Use a Kruskal-Wallis test to test the claim that the samples come from populations with equal medians. Listed
below are grade averages for randomly selected students with three different categories of high-school
background. At the 0.05 level of significance, test the claim that the three groups have the same median grade
average. HIGH SCHOOL RECORD Good FairPoor 3.212.872.01 3.653.052.31 1.002.002.98 3.120.000.50 2.751.982.36
(Essay)
4.8/5 (37)
A rank correlation coefficient is to be calculated for a collection of paired data. The values lie between -10 and 10. Which of the following could affect the value of the rank correlation coefficient?
I: Multiplying every value of one variable by 3
II: Interchanging the two variables
III: Adding 2 to each value of one variable
IV: Replacing every value of one variable by its absolute value
(Multiple Choice)
4.8/5 (45)
Use the sign test to test the indicated claim. A researcher wishes to test whether a particular diet has an effect on
blood pressure. The blood pressure of 25 randomly selected adults is measured. After one month on the diet,
each person's blood pressure is again measured. For 19 people, the second blood pressure reading was lower
than the first, and for 6 people, the second blood pressure reading was higher than the first. At the 0.01
significance level, test the claim that the diet has an effect on blood pressure.
(Essay)
4.7/5 (29)
Describe the Wilcoxon rank-sum test. What type of hypotheses is it used to test? What assumptions are made
for this test? What is the underlying concept?
(Essay)
4.7/5 (34)
A standard aptitude test is given to several randomly selected programmers, and the scores are given below for the
mathematics and verbal portions of the test. Use the sign test to test the claim that programmers do better on the
mathematics portion of the test. Use a 0.05 level of significance. Mathematics 347 440 327 456 427 349 377 398 425 Verbal 285 378 243 371 340 271 294 322 385
(Essay)
4.9/5 (31)
Test the sequence of digits below for randomness of odd and even digits. 0 4 7 3 6 0 9 7 4 8 7 2 8 5 7 3 9 6 4 6 4 7 9 1 6 1 9 5 8 3 7 8 5 7 3 5 2 9 3 8
(Essay)
4.9/5 (33)
Find the critical value. Assume that the test is two-tailed and that n denotes the number of pairs of data.
-Given that the rank correlation coefficient, r , for 37 pairs of data is 0.324, test the claim of correlation between
the two variables. Use a significance level of 0.01.
(Essay)
4.8/5 (30)
Use the sign test to test the indicated claim. An instructor gives a test before and after a lesson and results from
randomly selected students are given below. At the 0.05 level of significance, test the claim that the lesson has no effect
on the grade. Use the sign test. Before 54 61 56 41 38 57 42 71 88 42 36 23 22 46 51 After 82 87 84 76 79 87 42 97 99 74 85 96 69 84 79
(Essay)
4.9/5 (41)
Find the critical value. Assume that the test is two-tailed and that n denotes the number of pairs of data.
-The scores of twelve students on the midterm exam and the final exam were as follows. Student Midterm Final Nauarro 93 91 Reaves 89 85 Hurlburt 71 73 Knuth 65 77 Lengye1 62 67 Mcmeekan 74 79 Bolker 77 65 Ammatto 87 83 Pothakos 82 89 Sul1 ivan 81 71 Hahl 91 81 Zurfluh 83 94 Find the rank correlation coefficient and test the claim of correlation between midterm score and final exam
score. Use a significance level of 0.05.
(Essay)
4.9/5 (42)
Find the critical value. Assume that the test is two-tailed and that n denotes the number of pairs of data.
-Ten trucks were ranked according to their comfort levels and their prices. Make Comfort Price 1 6 6 2 2 3 8 1 4 4 7 8 9 10 1 9 3 5 5 7 Find the rank correlation coefficient and test the claim of correlation between comfort and price. Use a
significance level of 0.05.
(Essay)
4.7/5 (34)
A true-false test had the following answer sequence.
T T T T F T F T F T F T T F T
T T F F F F F F F T F T F T F
Test the null hypothesis that the sequence was random.
(Essay)
4.9/5 (31)
The heights of 16 randomly selected women are given below. Use a significance level of 0.05 to test the claim
that the population median is equal to 64.0 inches. 62.9 61.9 66.4 68.5 63.7 64.0 65.2 67.0 70.2 65.3 64.0 60.3 64.3 66.9 65.0 63.8
(Essay)
4.8/5 (42)
Match the nonparametric test with its related parametric test. Runs test
(Multiple Choice)
4.9/5 (38)
The following scatterplot shows the percentage of the vote a candidate received in the 2004 senatorial elections according to the voter's income level based on an exit poll of voters conducted by CNN. The income levels 1-8 correspond to the following income classes: 1=Under $15,000; 2=$15-30,000; 3=$30-50,000; 4=$50-75,000; 5=$75-100,000; 6=$100-150,000;
7=$150-200,000; 8=$200,000 or more. 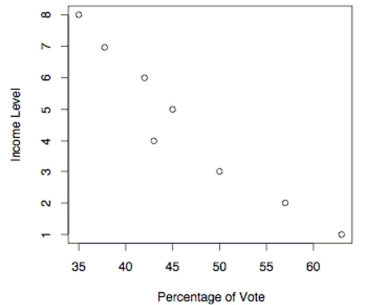 -Use the election scatterplot to the find the critical values corresponding to a 0.01 significance level used to test the null hypothesis of
(Multiple Choice)
4.9/5 (38)
A researcher wishes to study whether music has any effect on the ability to memorize information. 91 randomly
selected adults are given a memory test in a quiet room. They are then given a second memory test while
listening to classical music. 68 people received a higher score on the second test, 22 a lower score, and 1 received
the same score. At the 0.05 significance level, test the claim that the music has no effect on memorization skills.
(Essay)
4.8/5 (28)
Filters
- Essay(0)
- Multiple Choice(0)
- Short Answer(0)
- True False(0)
- Matching(0)