Exam 13: Nonparametric Tests
Exam 1: Introduction to Statistics155 Questions
Exam 2: Exploring Data With Tables and Graphs132 Questions
Exam 3: Describing, Exploring, and Comparing Data225 Questions
Exam 4: Probability219 Questions
Exam 5: Discrete Probability Distributions205 Questions
Exam 6: Normal Probability Distributions254 Questions
Exam 7: Estimating Parameters and Determining Sample Sizes170 Questions
Exam 8: Hypothesis Testing187 Questions
Exam 9: Inferences From Two Samples192 Questions
Exam 10: Correlation and Regression174 Questions
Exam 11: Goodness-Of-Fit and Contingency Tables100 Questions
Exam 12: Analysis of Variance113 Questions
Exam 13: Nonparametric Tests121 Questions
Exam 14: Statistical Process Control90 Questions
Select questions type
An instructor gives a test before and after a lesson and results from randomly selected students are given below.
At the 0.05 level of significance, test the claim that the lesson has no effect on the grade. Use the sign test. Before 54 61 56 41 38 57 42 71 88 42 36 23 22 46 51 After 82 87 84 76 79 87 42 97 99 74 85 96 69 84 79
(Essay)
4.9/5  (38)
(38)
Critical values for the runs test for randomness can be calculated by listing all possible sequences. Using the elements list the 20 different possible sequences. Find the number of runs for each sequence. Are you able to find cutoff values for G? What do you conclude?
(Essay)
4.9/5 (42)
If test A has an efficiency rating of 0.94 as compared to test B, explain what that efficiency rating means. Do
comparable nonparametric or parametric tests have higher efficiency ratings?
(Essay)
4.8/5 (30)
Define rank. Explain how to find the rank for data which repeats (for example, the data set: 4, 5, 5, 5, 7, 8, 12, 12,
15, 18).
(Essay)
4.8/5 (43)
11 runners are timed at the 100-meter dash and are timed again one month later after following a new training
program. The times (in seconds) are shown in the table. Use Wilcoxon's signed-ranks test and a significance
level of 0.05 to test the claim that the training has no effect on the times. Before 12.1 12.4 11.7 11.5 11.0 11.8 12.3 10.8 12.6 12.7 10.7 After 11.9 12.4 11.8 11.4 11.2 11.5 12.0 10.9 12.0 12.2 11.1
(Essay)
4.9/5 (34)
SAT scores for students selected randomly from two different schools are shown below. Use a significance level
of 0.05 to test the claim that the scores for the two schools are from populations with the same median. 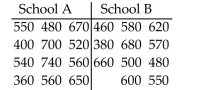
(Essay)
4.7/5 (44)
Which of the following terms is sometimes used instead of "non-parametric test"?
(Multiple Choice)
4.9/5 (34)
Describe the sign test. What types of hypotheses is it used to test? What is the underlying concept?
(Essay)
4.8/5 (37)
The Mann-Whitney U test is equivalent to the Wilcoxon rank-sum test for independent samples in the sense
that they both apply to the same situations and always lead to the same conclusions. In the Mann-Whitney U
test we calculate For the sample data below, use the Mann-Whitney U test to test the null hypothesis that the two independent
samples come from populations with the same median. State the hypotheses, the value of the test statistic, the
critical values, and your conclusion. Test scores (men):
Test scores (women):
(Essay)
4.7/5 (41)
Use the rank correlation coefficient to test for a correlation between the two variables. Use the sample data
below to find the rank correlation coefficient and test the claim of correlation between math and verbal scores.
Use a significance level of 0.05. Mathematics 347 440 327 456 427 349 377 398 425 Verbal 285 378 243 371 340 271 294 322 385
(Essay)
4.9/5 (45)
When applying the runs test for randomness above and below the median for 10 scores on a final exam, the test
statistic is G = 2. What does that value tell us about the data?
(Essay)
4.9/5 (34)
When performing a rank correlation test, one alternative to using the Critical Values of Spearman's Rank Correlation Coefficient table to find critical values is to compute them using this approximation:
where is the t-score from the Distribution table corresponding to degrees of freedom. Use this approximation to find critical values of for the case where and .
(Multiple Choice)
4.9/5 (35)
Use the rank correlation coefficient to test for a correlation between the two variables. Ten trucks were ranked
according to their comfort levels and their prices. Make Comfort Price A 1 6 B 6 2 C 2 3 D 8 1 E 4 4 F 7 8 G 9 10 H 10 9 I 3 5 J 5 7 Find the rank correlation coefficient and test the claim of correlation between comfort and price. Use a significance level
of 0.05.
(Essay)
4.8/5 (34)
Use the rank correlation coefficient to test for a correlation between the two variables. Given that the rank
correlation coefficient, for 37 pairs of data is 0.324, test the claim of correlation between the two variables.
Use a significance level of 0.01.
(Essay)
4.8/5 (22)
The waiting times (in minutes) of 28 randomly selected customers in a bank are given below. Use a significance
level of 0.05 to test the claim that the population median is equal to 5.3 minutes. 8.2 8.0 10.5 3.8 6.4 5.3 7.8 2.9 6.0 7.7 6.1 5.9 1.2 10.4 7.3 6.9 5.8 5.1 6.2 3.1 5.8 11.7 4.5 6.5 9.8 7.4 2.3 7.8
(Essay)
4.7/5 (40)
A pollster interviews voters and claims that her selection process is random. Listed below is the sequence of
voters identified according to gender. At the 0.05 level of significance, test her claim that the sequence is random
according to the criterion of gender. ,,,,,,,,,,,,,,, ,,,,,,,,,,,,,,,
(Essay)
4.8/5 (43)
Use the Wilcoxon rank-sum approach to test the claim that the sample student grade averages at two colleges
come from populations with the same median. The sample data is listed below. Use a 0.05 level of significance,
and assume that the samples were randomly selected. College A 3.2 4.0 2.4 2.6 2.0 1.8 1.3 0.0 0.5 1.4 2.9 College B 2.4 1.9 0.3 0.8 2.8 3.0 3.1 3.1 3.1 3.5 3.5
(Essay)
4.8/5 (43)
In a study of the effectiveness of physical exercise in weight reduction, 12 subjects followed a program of physical exercise for two months. Their weights (in pounds) before and after this program are shown in the
Table. Use Wilcoxon's signed-ranks test and a significance level of 0.05 to test the claim that the exercise
Program has no effect on weight. Before 162 190 188 152 148 127 195 164 175 156 180 136 After 157 194 179 149 135 130 183 168 168 148 170 138 What would be the signed rank for the column with values of 175 and 168?
(Multiple Choice)
4.7/5 (42)
A rank correlation coefficient is to be calculated for a collection of paired data. The values lie between -10 and 10. Which of the following could affect the value of the rank correlation coefficient? I: Multiplying every value of one variable by 3
II: Interchanging the two variables
III: Adding 2 to each value of one variable
IV: Replacing every value of one variable by its absolute value
(Multiple Choice)
4.8/5 (36)
When performing a rank correlation test, one alternative to using the Critical Values of Spearman's Rank Correlation Coefficient table to find critical values is to compute them using this approximation:
where is the t-score from the Distribution table corresponding to degrees of freedom. Use this approximation to find critical values of for the case where and .
(Multiple Choice)
4.9/5 (31)
Filters
- Essay(0)
- Multiple Choice(0)
- Short Answer(0)
- True False(0)
- Matching(0)