Exam 13: Nonparametric Tests
Exam 1: Introduction to Statistics155 Questions
Exam 2: Exploring Data With Tables and Graphs132 Questions
Exam 3: Describing, Exploring, and Comparing Data225 Questions
Exam 4: Probability219 Questions
Exam 5: Discrete Probability Distributions205 Questions
Exam 6: Normal Probability Distributions254 Questions
Exam 7: Estimating Parameters and Determining Sample Sizes170 Questions
Exam 8: Hypothesis Testing187 Questions
Exam 9: Inferences From Two Samples192 Questions
Exam 10: Correlation and Regression174 Questions
Exam 11: Goodness-Of-Fit and Contingency Tables100 Questions
Exam 12: Analysis of Variance113 Questions
Exam 13: Nonparametric Tests121 Questions
Exam 14: Statistical Process Control90 Questions
Select questions type
Listed below are grade averages for randomly selected students with three different categories of high-school
background. At the 0.05 level of significance, test the claim that the three groups have the same median grade
average. 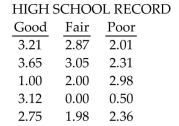
(Essay)
4.8/5  (41)
(41)
Use the runs test to determine whether the given sequence is random. Use a significance level of 0.05. The
sequence of numbers below represents the maximum temperature (in degrees Fahrenheit) in July in one U.S.
town for 30 consecutive years. Test the sequence for randomness above and below the median. 94 96 97 99 95 90 97 98 100 100 92 95 98 99 102 97 97 101 99 100 98 95 93 99 101 99 101 100 99 103
(Essay)
4.9/5 (43)
The sequence of numbers below represents the maximum temperature (in degrees Fahrenheit) in July in one
U.S. town for 30 consecutive years. Test the sequence for randomness above and below the median. 94 96 97 99 95 90 97 98 100 100
92 95 98 99 102 97 97 101 99 100
98 95 93 99 101 99 101 100 99 103
(Essay)
4.9/5 (31)
If the critical values for a run test (found from table A-10) are 8 and 19 and the G value is 17, what should your conclusion about randomness be?
(Multiple Choice)
4.9/5 (34)
Describe the rank correlation test. What types of hypotheses is it used to test? How does the rank correlation
coefficient rs differ from the Pearson correlation coefficient r?
(Essay)
4.8/5 (37)
Find the critical value. Assume that the test is two-tailed and that n denotes the number of pairs of data.
-
(Multiple Choice)
4.8/5 (25)
Describe the runs test for randomness. What types of hypotheses is it used to test? Does the runs test measure
frequency? What is the underlying concept?
(Essay)
4.8/5 (41)
An instructor gives a test before and after a lesson and results from randomly selected students are given below.
Use Wilcoxon's signed-ranks test and a 0.05 significance level to test the claim that the lesson has no effect on
the grade. Before 54 61 56 41 38 57 42 71 88 42 36 23 22 46 51 After 82 87 84 76 79 87 42 97 99 74 85 96 67 84 79
(Essay)
4.8/5 (40)
Match the parametric test with its related nonparametric test. Analysis of variance (F test)
(Multiple Choice)
4.9/5 (37)
The following scatterplot shows the percentage of the vote a candidate received in the 2004 senatorial elections according to the voter's income level based on an exit poll of voters conducted by CNN. The income levels 1-8 correspond to the
Following income classes: 1= Under \ 15,000;2=\ 15-30,000;3=\ 30-50,000;4=\ 50-75,000;5=\ 75-100,000;6=\ 100-150,000;7= \ 150-200,000;8=\ 200,000 or more. 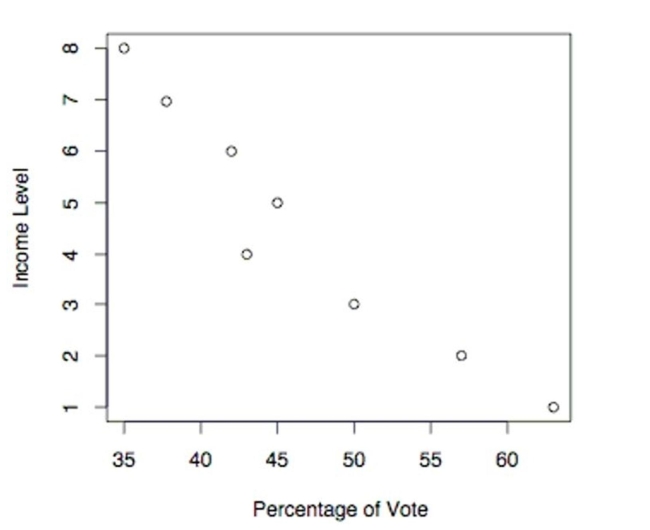 Use the election scatterplot to determine whether there is a correlation between percentage of vote and income level at
The 0.01 significance level with a null hypothesis of
Use the election scatterplot to determine whether there is a correlation between percentage of vote and income level at
The 0.01 significance level with a null hypothesis of
(Multiple Choice)
4.9/5 (41)
A teacher uses two different CAI programs to remediate a randomly selected group of students. Results
for each group on a standardized test are listed in a table below. At the 0.05 level of significance, test the
hypothesis that the sample results are from populations with the same median. 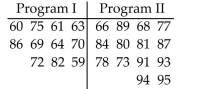
(Essay)
4.8/5 (36)
The following scatterplot shows the percentage of the vote a candidate received in the 2004 senatorial elections according to the voter's income level based on an exit poll of voters conducted by CNN. The income levels 1-8 correspond to the following income classes:
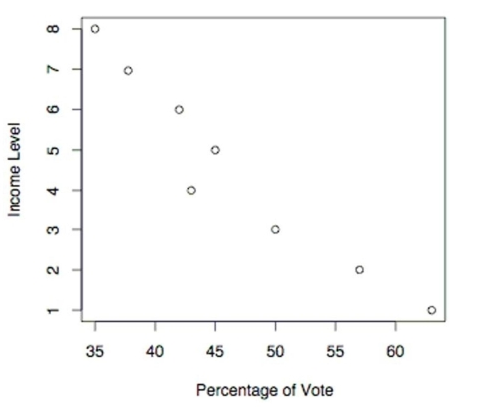 Use the election scatterplot to the find the critical values corresponding to a significance level used to test thi hypothesis of .
(Multiple Choice)
4.9/5 (43)
A sample of 30 clock radios is selected in sequence from an assembly line. Each radio is examined and judged to
be acceptable (A) or defective (D). The results are shown below. Test for randomness.
(Essay)
4.9/5 (37)
A researcher wishes to test whether a particular diet has an effect on blood pressure. The blood pressure of 25
randomly selected adults is measured. After one month on the diet, each person's blood pressure is again
measured. For 19 people, the second blood pressure reading was lower than the first, and for 6 people, the
second blood pressure reading was higher than the first. At the 0.01 significance level, test the claim that the diet
has an effect on blood pressure.
(Essay)
4.8/5 (36)
In using the Kruskal-Wallis test, there is a correction factor that should be applied whenever there are many ties: Divide H by For each group of tied observations, calculate T
t, where t is the number of observations that are tied
Within the individual group. Find t for each group of tied values, then compute the value of T for each group,
Then add the T values to get . The total number of observations in all samples combined is N. Find the
Corrected value of H for the data below which represents test scores for three different groups. Group 1: 20 18 18 18 20 20 Group 2: 18 12 18 18 20 Group 3: 16 18 13 18 18
(Multiple Choice)
4.7/5 (31)
The Wilcoxon signed-ranks test can be used to test the claim that a sample comes from a population with a
specified median. The procedure used is the same as the one described in this section except that the differences
are obtained by subtracting the value of the hypothesized median from each value.
The sample data below represent the weights (in pounds) of 12 women aged 20-30. Use a Wilcoxon
signed-ranks test to test the claim that the median weight of women aged 20-30 is equal to 130 pounds. Use a
significance level of 0.05. Be sure to state the hypotheses, the value of the test statistic, the critical values, and
your conclusion. 140 116 125 120 153 140 111 127 133 137 132 160
(Essay)
4.8/5 (40)
Use a 0.05 level of significance to test the claim that the sequence of computer-generated numbers is random. Test
for randomness above and below the mean. 8 7 5 7 3 9 1 8 0 4 3 8 4 6 2 3 9 7 5
(Essay)
4.8/5 (29)
Use a 0.05 level of significance to test the claim that the sequence of computer-generated numbers is random.
Test for randomness above and below the mean. 87 7 7 3 9 1 0 4 4 4 4 4 4
(Essay)
4.7/5 (38)
Answers to a questionnaire were in the following sequence. Test for randomness.
(Essay)
4.8/5 (39)
Use the Wilcoxon rank-sum test to test the claim that the two independent samples come from populations with
equal medians. Use the Wilcoxon rank-sum approach to test the claim that the sample student grade averages
at two colleges come from populations with the same median. The sample data is listed below. Use a 0.05 level
of significance, and assume that the samples were randomly selected. College A 3.2 4.0 2.4 2.6 2.0 1.8 1.3 0.0 0.5 1.4 2.9 College B 2.4 1.9 0.3 0.8 2.8 3.0 3.1 3.1 3.1 3.5 3.5
(Essay)
4.9/5 (39)
Filters
- Essay(0)
- Multiple Choice(0)
- Short Answer(0)
- True False(0)
- Matching(0)