Exam 22: Supplement E Simulation
Exam 1: Using Operations to Create Value115 Questions
Exam 2: Process Strategy and Analysis239 Questions
Exam 3: Quality and Performance198 Questions
Exam 4: Capacity Planning120 Questions
Exam 5: Constraint Management136 Questions
Exam 6: Lean Systems166 Questions
Exam 7: Project Management139 Questions
Exam 8: Forecasting150 Questions
Exam 9: Inventory Management205 Questions
Exam 10: Operations Planning and Scheduling149 Questions
Exam 11: Resource Planning124 Questions
Exam 12: Supply Chain Design77 Questions
Exam 13: Supply Chain Logistic Networks114 Questions
Exam 14: Supply Chain Integration120 Questions
Exam 15: Supply Chain Sustainability78 Questions
Exam 16: Supplement A Decision Making107 Questions
Exam 17: Supplement J Operations Scheduling123 Questions
Exam 18: Supplement K Layout39 Questions
Exam 19: Supplement B Waiting Lines111 Questions
Exam 20: Supplement C Special Inventory Models53 Questions
Exam 21: Supplement D Linear Programming87 Questions
Exam 22: Supplement E Simulation54 Questions
Exam 23: Supplement F Financial Analysis55 Questions
Exam 24: Supplement G Acceptance Sampling Plans87 Questions
Exam 25: Supplement H Measuring Output Rates108 Questions
Exam 26: Supplement I Learning Curve Analysis50 Questions
Select questions type
How can random numbers be generated?
Free
(Essay)
4.8/5  (42)
(42)
Correct Answer: Verified
Random numbers can be generated by a computer, looking them up in a collection, or generation by some mechanical means. A package like Excel can generate random numbers using the RAND() function, which generates uniformly distributed random numbers within the interval [0,1]. In the absence of a computer, random numbers can be looked up in published tables of random numbers. Finally, the modeler can observe some physical phenomenon as a source of random numbers, such as flipping a coin.
A number that has the same probability of being selected as any other number is a(n) ________.
Free
(Short Answer)
5.0/5 (38)
Correct Answer:Verified
random number
What is the difference between a waiting line model as described in Supplement B and a simulation model of a waiting line problem?
Free
(Essay)
4.8/5 (30)
Correct Answer:Verified
The waiting line model describes the operating characteristics of interest with known equations. The simulation model actually mimics the arrival of customers and their service, empirically calculating the operating characteristics.
What are the differences between decision variables and uncontrolled variables? Describe the differences and provide an example from a simulation model.
(Essay)
4.7/5 (34)
SimQuick can be used to simulate all of the following except:
(Multiple Choice)
4.9/5 (34)
The manager of a branch bank wants to build a simulation model of the lobby operation to reduce the waiting time of her customers. The number of customers waiting in line at any point of time is an example of a(n):
(Multiple Choice)
4.8/5 (32)
Steady state occurs when the simulation is repeated over enough time that the average results for performance measures remain constant.
(True/False)
4.8/5 (31)
Refer to the bank process model. The bank's process improvement group has developed a number of process and technology changes that will improve the Teller's process rate per customer from a mean of 3.0 minutes to 2.5 minutes (standard deviation remains at 0.5 minutes). The Bank Manager wants to determine if the improved process rate, along with the special promotion for new customers, will allow the "arrive and immediately leave" rate and average customer wait time in line achieved to still be met (12% balk rate, 9.95 minutes in line). If so, the manager will implement the process and technology changes and allow the special promotion to proceed. Using SimQuick, estimate the new arrive and immediately leave rate and average time in line. What decision should the manager make?
(Essay)
4.8/5 (20)
Scenario E.1
SimQuick is being used to simulate the following bank process:
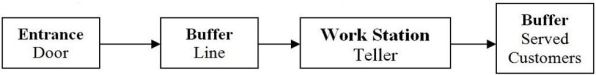 Customer arrivals at the Entrance Door of the bank with an average time between arrivals of 2.5 minutes. The Line Buffer holds 6 customers. If a customer arrives and the buffer line is filled, the customer leaves. The Work Station Teller's processing time per customer is normally distributed, with a mean of 3.0 minutes and a standard deviation of 0.5 minutes. The Served Customer Buffer in the flow chart is used to count the number of customers processed during the period simulated. A 2-hour period was simulated.
The SimQuick simulation is run, and the results are as follows:
Customer arrivals at the Entrance Door of the bank with an average time between arrivals of 2.5 minutes. The Line Buffer holds 6 customers. If a customer arrives and the buffer line is filled, the customer leaves. The Work Station Teller's processing time per customer is normally distributed, with a mean of 3.0 minutes and a standard deviation of 0.5 minutes. The Served Customer Buffer in the flow chart is used to count the number of customers processed during the period simulated. A 2-hour period was simulated.
The SimQuick simulation is run, and the results are as follows:
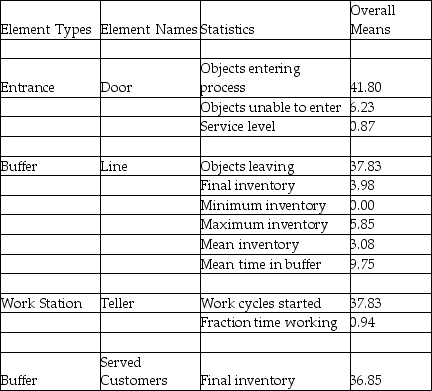 -Use the information in Scenario E.1. On average, approximately how many customers were waiting in line during the 2-hour simulation period?
(Multiple Choice)
4.9/5 (40)
In Excel, the RAND() function generates either a 0 or a 1, purely at random.
(True/False)
4.9/5 (31)
________ is the act of reproducing the behavior of a system using a model that describes the processes of the system.
(Short Answer)
4.8/5 (38)
When using Excel for simulation, it is important to freeze the random numbers used in order to compare the effectiveness of different policies. To do this, you must select the cells holding the random numbers with the mouse, click Edit/Copy at the top of the spreadsheet, and:
(Multiple Choice)
4.9/5 (26)
This table shows the distribution of grades in an operations management class. 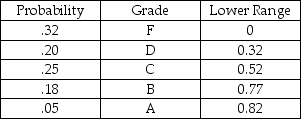 Add a column to the table that shows the cumulative probability and indicate what letter grade is obtained when the RAND() function is equal to 0.7406.
(Multiple Choice)
4.8/5 (32)
What is steady state in a simulation model? Why is it important to achieve steady state?
(Essay)
4.8/5 (30)
If the data needed to set up a simulation are available in company records, the technique used to obtain them is called ________.
(Short Answer)
4.7/5 (35)
Why would data need to be collected prior to conducting a simulation?
(Essay)
4.9/5 (40)
This table shows the distribution of grades in an operations management class. 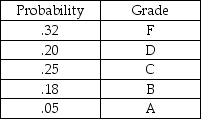 Add a column to the table that shows the cumulative probability and indicate what letter grade is obtained when the RAND() function is equal to 0.982245.
(Multiple Choice)
4.8/5 (36)
Filters
- Essay(0)
- Multiple Choice(0)
- Short Answer(0)
- True False(0)
- Matching(0)