Exam 8: Forecasting
Exam 1: Using Operations to Create Value115 Questions
Exam 2: Process Strategy and Analysis239 Questions
Exam 3: Quality and Performance198 Questions
Exam 4: Capacity Planning120 Questions
Exam 5: Constraint Management136 Questions
Exam 6: Lean Systems166 Questions
Exam 7: Project Management139 Questions
Exam 8: Forecasting150 Questions
Exam 9: Inventory Management205 Questions
Exam 10: Operations Planning and Scheduling149 Questions
Exam 11: Resource Planning124 Questions
Exam 12: Supply Chain Design77 Questions
Exam 13: Supply Chain Logistic Networks114 Questions
Exam 14: Supply Chain Integration120 Questions
Exam 15: Supply Chain Sustainability78 Questions
Exam 16: Supplement A Decision Making107 Questions
Exam 17: Supplement J Operations Scheduling123 Questions
Exam 18: Supplement K Layout39 Questions
Exam 19: Supplement B Waiting Lines111 Questions
Exam 20: Supplement C Special Inventory Models53 Questions
Exam 21: Supplement D Linear Programming87 Questions
Exam 22: Supplement E Simulation54 Questions
Exam 23: Supplement F Financial Analysis55 Questions
Exam 24: Supplement G Acceptance Sampling Plans87 Questions
Exam 25: Supplement H Measuring Output Rates108 Questions
Exam 26: Supplement I Learning Curve Analysis50 Questions
Select questions type
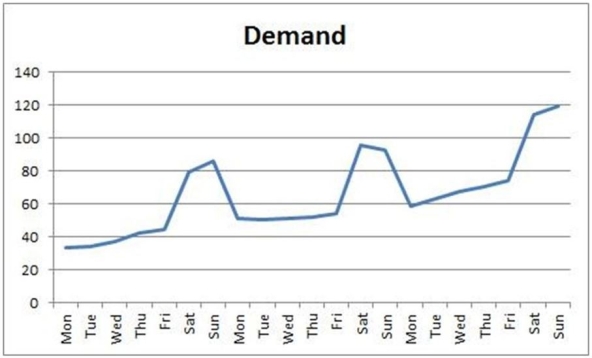
Graph 8.1
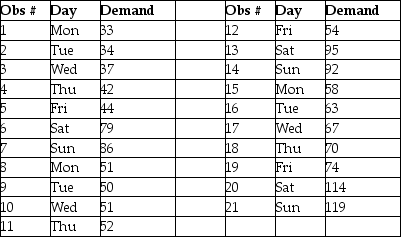
Data plotted in the graph appear in the table below.
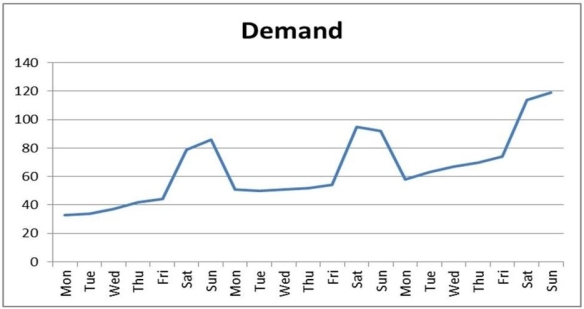
 -Refer to Graph 8.1. Use a trend projection to forecast the next week's demand. Then apply seasonal indices to determine the demand on Saturday of the fourth week. What is the demand projected to be?
Free
(Multiple Choice)
4.9/5  (32)
(32)
Correct Answer: Verified
A
A bias error results from unpredictable factors that cause the forecast to deviate from actual demand.
Free
(True/False)
4.8/5 (30)
Correct Answer:Verified
False
The ________ variable is the variable that one wants to forecast.
Free
(Short Answer)
4.8/5 (40)
Correct Answer:Verified
dependent
Focus forecasting selects the best forecast from a group of forecasts generated by individual techniques.
(True/False)
4.9/5 (35)
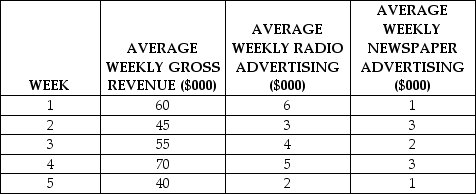
Table 8.4
The Furniture Super Mart is a furniture retailer in Evansville, Indiana. The Marketing Manager wants to prepare a media budget based on the next quarter's business plan. The manager wants to decide the mix of radio advertising and newspaper advertising needed to generate varying levels of Weekly Gross Revenue. The manager has collected data for the past five weeks, and has recorded the following average Weekly Gross Revenues and expenditures for Weekly Radio (X1) and Newspaper (X2) advertising:
 The Manager uses the multiple regression model in OM Explorer and obtains the following results:
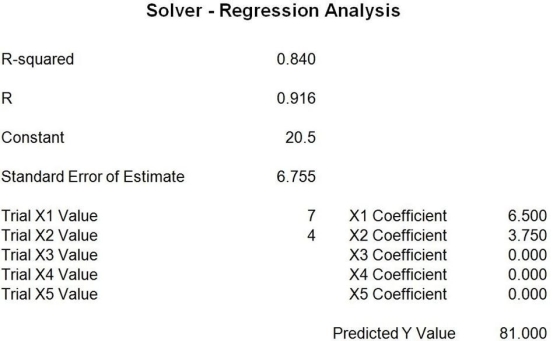 -Use the information provided in Table 8.4. What is the estimated Weekly Gross Revenue if $4,000 is spent on Radio Advertising (X1) and $7,000 is spent on Newspaper Advertising (X2)?
(Multiple Choice)
4.9/5 (36)
Graph 8.1
Data plotted in the graph appear in the table below.
-Refer to Graph 8.1. What is the seasonal index for the first Saturday in the data set?
(Multiple Choice)
4.9/5 (30)
A tracking signal greater than zero and a mean absolute deviation greater than zero imply that the forecast has:
(Multiple Choice)
4.7/5 (31)
The judgment methods of forecasting are to be used for purposes of:
(Multiple Choice)
4.9/5 (33)
When the underlying mean of a time series is very stable and there are no trend, cyclical, or seasonal influences:
(Multiple Choice)
4.8/5 (31)
A(n) ________ forecast is a time-series method whereby the forecast for the next period equals the demand for the current period.
(Short Answer)
4.8/5 (29)
Graph 8.1
Data plotted in the graph appear in the table below.
-If forecast errors are normally distributed with a mean of 0, the relationship between σ and MAD is:
(Multiple Choice)
4.7/5 (37)
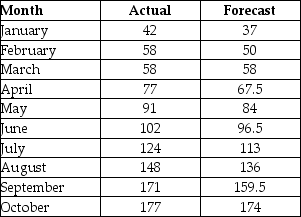
Ten months of data and the forecasts for those same periods are in the table below. Use mean bias, MAD, and MAPE to analyze the accuracy of the forecasts.
(Essay)
4.8/5 (33)
An exponential smoothing model with an alpha equal to 1.00 is the same as a naive forecasting model.
(True/False)
4.7/5 (40)
Describe some of the managerial considerations required to utilize big data effectively.
(Essay)
4.9/5 (32)
A simple moving average of one period will yield identical results to a naive forecast.
(True/False)
5.0/5 (35)
________ are produced by averaging independent forecasts based on different methods or different data, or both.
(Short Answer)
4.7/5 (38)
There are historically three 32-month periods of generally rising prices in the stock market for every one 9-month period of falling prices. This observation leads you to conclude that the stock market exhibits a:
(Multiple Choice)
4.9/5 (30)
Table 8.6
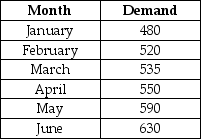 -Use the information in Table 8.6. Use an exponential smoothing model with a smoothing parameter of 0.30 and an April forecast of 525 to determine what the forecast sales would have been for June.
(Multiple Choice)
4.7/5 (29)
Three weeks of data are available from a restaurant. Develop a forecast and explain why your approach is reasonable.
(Essay)
4.9/5 (36)
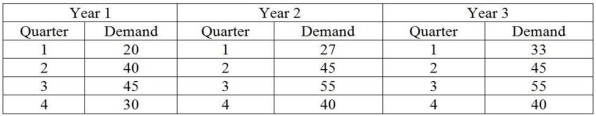
A local moving company has collected data on the number of moves they have been asked to perform over the past three years. Moving is highly seasonal, so the owner/operator, who is both burly and highly educated, decides to apply the multiplicative seasonal method (based on a linear regression for total demand) to forecast the number of customers for the coming year. What is his forecast for each quarter?
(Essay)
4.8/5 (26)
Filters
- Essay(0)
- Multiple Choice(0)
- Short Answer(0)
- True False(0)
- Matching(0)