Exam 22: Supplement E Simulation
Exam 1: Using Operations to Create Value115 Questions
Exam 2: Process Strategy and Analysis239 Questions
Exam 3: Quality and Performance198 Questions
Exam 4: Capacity Planning120 Questions
Exam 5: Constraint Management136 Questions
Exam 6: Lean Systems166 Questions
Exam 7: Project Management139 Questions
Exam 8: Forecasting150 Questions
Exam 9: Inventory Management205 Questions
Exam 10: Operations Planning and Scheduling149 Questions
Exam 11: Resource Planning124 Questions
Exam 12: Supply Chain Design77 Questions
Exam 13: Supply Chain Logistic Networks114 Questions
Exam 14: Supply Chain Integration120 Questions
Exam 15: Supply Chain Sustainability78 Questions
Exam 16: Supplement A Decision Making107 Questions
Exam 17: Supplement J Operations Scheduling123 Questions
Exam 18: Supplement K Layout39 Questions
Exam 19: Supplement B Waiting Lines111 Questions
Exam 20: Supplement C Special Inventory Models53 Questions
Exam 21: Supplement D Linear Programming87 Questions
Exam 22: Supplement E Simulation54 Questions
Exam 23: Supplement F Financial Analysis55 Questions
Exam 24: Supplement G Acceptance Sampling Plans87 Questions
Exam 25: Supplement H Measuring Output Rates108 Questions
Exam 26: Supplement I Learning Curve Analysis50 Questions
Select questions type
Using a simulation model to gather a year of operating data in a few minutes is known as:
(Multiple Choice)
4.8/5  (42)
(42)
SimQuick is to be used to simulate the following bank process:
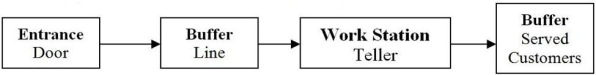 Customers arrive at the Entrance Door of the bank with an average time between arrivals of 2.5 minutes. The Line Buffer holds 6 customers. If a customer arrives and the buffer line is filled, the customer leaves. The Work Station Teller's processing time per customer is normally distributed, with a mean of 3.0 minutes and a standard deviation of 0.5 minutes. The Served Customer Buffer in the flowchart is used to count the number of customers processed during the simulation period. A 2-hour period is to be simulated and the simulation should be repeated 30 times. Determine:
a) The number of customers served during the 2-hour period;
b) The percentage of customers who arrived at the bank and left because the buffer line was full;
c) The utilization of the teller (% of time working) during the 2-hour period;
Customers arrive at the Entrance Door of the bank with an average time between arrivals of 2.5 minutes. The Line Buffer holds 6 customers. If a customer arrives and the buffer line is filled, the customer leaves. The Work Station Teller's processing time per customer is normally distributed, with a mean of 3.0 minutes and a standard deviation of 0.5 minutes. The Served Customer Buffer in the flowchart is used to count the number of customers processed during the simulation period. A 2-hour period is to be simulated and the simulation should be repeated 30 times. Determine:
a) The number of customers served during the 2-hour period;
b) The percentage of customers who arrived at the bank and left because the buffer line was full;
c) The utilization of the teller (% of time working) during the 2-hour period;
(Essay)
4.8/5 (41)
To generate 100 random numbers in an Excel simulation, the "=RAND()" function is first typed into the A1 cell on an Excel spreadsheet. A1 can then be copied and pasted in a rectangular area on the spreadsheet to cover the cells:
(Multiple Choice)
4.8/5 (32)
________ occurs when the simulation is repeated over enough time that the average results for performance measures remain constant.
(Short Answer)
4.8/5 (43)
The manager of a branch bank wants to build a simulation model of the lobby operation to reduce the waiting time of her customers. The number of tellers is an example of:
(Multiple Choice)
4.9/5 (36)
________ are random events that the decision maker cannot control.
(Short Answer)
4.8/5 (40)
Any random number has the same likelihood of being selected as any other, regardless of how recently it has been selected.
(True/False)
4.8/5 (31)
A simulation model is used to test the impact of the number of sample customers at a supermarket. As the model is run, the decision maker watches the average number of customers in the store rapidly increase from zero until it levels off and holds a constant value. The simulation model is:
(Multiple Choice)
4.9/5 (49)
What are the motivations for using simulation for analyzing processes?
(Essay)
4.9/5 (41)
Monte Carlo simulation is the use of computer graphics to show customers or products moving through a series of process steps.
(True/False)
4.8/5 (33)
Scenario E.1
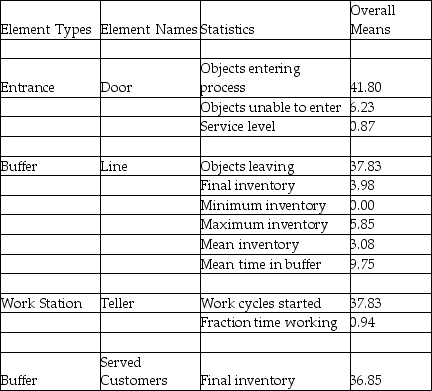
SimQuick is being used to simulate the following bank process:
 Customer arrivals at the Entrance Door of the bank with an average time between arrivals of 2.5 minutes. The Line Buffer holds 6 customers. If a customer arrives and the buffer line is filled, the customer leaves. The Work Station Teller's processing time per customer is normally distributed, with a mean of 3.0 minutes and a standard deviation of 0.5 minutes. The Served Customer Buffer in the flow chart is used to count the number of customers processed during the period simulated. A 2-hour period was simulated.
The SimQuick simulation is run, and the results are as follows:
Customer arrivals at the Entrance Door of the bank with an average time between arrivals of 2.5 minutes. The Line Buffer holds 6 customers. If a customer arrives and the buffer line is filled, the customer leaves. The Work Station Teller's processing time per customer is normally distributed, with a mean of 3.0 minutes and a standard deviation of 0.5 minutes. The Served Customer Buffer in the flow chart is used to count the number of customers processed during the period simulated. A 2-hour period was simulated.
The SimQuick simulation is run, and the results are as follows:
 -Use the information in Scenario E.1. Approximately how much time did the average customer who entered the system spend waiting in line?
(Multiple Choice)
4.7/5 (44)
To generate 80 random numbers in an Excel simulation, the "=RAND()" function is first typed into the C2 cell on an Excel spreadsheet. C2 is then copied and pasted in a rectangular area on the spreadsheet to cover the cells:
(Multiple Choice)
5.0/5 (31)
Time compression is the feature of simulation that allows managers to obtain operating-characteristic estimates in much less time than is required to gather the same operating data from a real system.
(True/False)
4.7/5 (29)
Simulation is the process of reproducing the behavior of a system using a model that describes the processes of the system.
(True/False)
4.8/5 (45)
Scenario E.1
SimQuick is being used to simulate the following bank process:
Customer arrivals at the Entrance Door of the bank with an average time between arrivals of 2.5 minutes. The Line Buffer holds 6 customers. If a customer arrives and the buffer line is filled, the customer leaves. The Work Station Teller's processing time per customer is normally distributed, with a mean of 3.0 minutes and a standard deviation of 0.5 minutes. The Served Customer Buffer in the flow chart is used to count the number of customers processed during the period simulated. A 2-hour period was simulated.
The SimQuick simulation is run, and the results are as follows:
-Use the information in Scenario E.1. Approximately how many total customers arrived during the 2-hour period simulated?
(Multiple Choice)
4.9/5 (41)
One hundred monkeys are typing in Excel spreadsheets when one of them enters =NORM.S.INV(RAND()) What is the result of this monkey's function?
(Multiple Choice)
4.9/5 (35)
Refer to the bank process model. The Marketing Department for the bank has decided to run a special promotion for new customers that will increase the number of customers arriving at the bank. The new arrival rate is expected to be an average time between arrivals of 2.0 minutes instead of the current average time between arrivals of 2.5 minutes. With the potential increase in business, the bank manager is concerned about the number of customers who will arrive and leave because the line is full (with 6 customers) and the average wait time in line at the bank. All other parameters of the model remain the same. Using SimQuick, estimate the new arrive and immediately leave rate and average time in line. Should the manager be concerned?
(Essay)
4.8/5 (34)
Filters
- Essay(0)
- Multiple Choice(0)
- Short Answer(0)
- True False(0)
- Matching(0)