Exam 3: Numerical Descriptive Measures
Exam 1: Defining and Collecting Data207 Questions
Exam 2: Organizing and Visualizing Variables213 Questions
Exam 3: Numerical Descriptive Measures167 Questions
Exam 4: Basic Probability171 Questions
Exam 5: Discrete Probability Distributions217 Questions
Exam 6: The Normal Distributions and Other Continuous Distributions189 Questions
Exam 7: Sampling Distributions135 Questions
Exam 8: Confidence Interval Estimation189 Questions
Exam 9: Fundamentals of Hypothesis Testing: One-Sample Tests187 Questions
Exam 10: Two-Sample Tests208 Questions
Exam 11: Analysis of Variance216 Questions
Exam 12: Chi-Square and Nonparametric Tests178 Questions
Exam 13: Simple Linear Regression214 Questions
Exam 14: Introduction to Multiple Regression336 Questions
Exam 15: Multiple Regression Model Building99 Questions
Exam 16: Time-Series Forecasting173 Questions
Exam 17: Business Analytics115 Questions
Exam 18: A Roadmap for Analyzing Data329 Questions
Exam 19: Statistical Applications in Quality Management Online162 Questions
Exam 20: Decision Making Online129 Questions
Exam 21: Understanding Statistics: Descriptive and Inferential Techniques39 Questions
Select questions type
As a rule, a value is considered an extreme value if its Z score is greater than 3.
(True/False)
4.8/5  (37)
(37)
SCENARIO 3-2 The data below represent the number of grams of carbohydrates in a serving of breakfast cereal in a sample of 11 different servings. 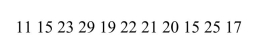 -Referring to Scenario 3-2, the range in the carbohydrate amounts is ________ grams.
(Short Answer)
4.9/5 (33)
The coefficient of variation is a measure of central tendency in the data.
(True/False)
4.8/5 (41)
SCENARIO 3-2 The data below represent the number of grams of carbohydrates in a serving of breakfast cereal in a sample of 11 different servings.
-Referring to Scenario 3-2, is the carbohydrate amount in the cereal leptokurtic or platykurtic?
(Short Answer)
4.8/5 (32)
SCENARIO 3-7 In a recent academic year, many public universities in the United States raised tuition and fees due to a decrease in state subsidies.The change in the cost of tuition, a shared dormitory room, and the most popular meal plan from the previous academic year for a sample of 10 public universities were as follows: $1,589, $593, $1,223, $869, $423, $1,720, $708, $1425, $922 and $308.
-Referring to Scenario 3-7, what is the interquartile range of the change in the cost?
(Short Answer)
4.9/5 (36)
SCENARIO 3-2 The data below represent the number of grams of carbohydrates in a serving of breakfast cereal in a sample of 11 different servings.
-Referring to Scenario 3-2, the arithmetic mean carbohydrates in this sample is ________ grams.
(Short Answer)
5.0/5 (36)
SCENARIO 3-11 Given below are the closing prices for the Dow Jones Industrial Average (DJIA)and the Standard & Poor's (S&P)500 Index over 10-weeks sometime in the past.  -Referring to Scenario 3-11, what is the sample correlation coefficient between the DJIA and the S&P 500 index?
(Short Answer)
4.7/5 (25)
SCENARIO 3-5 The rate of return of a Fortune 500 company over the past 15 years are: 3.17%, 4.43%, 5.93%, 5.43%, 7.29%, 8.21%, 6.23%, 5.23%, 4.34%, 6.68%, 7.14%, -5.56%, -5.23%, -5.73%, -10.34%
-Referring to Scenario 3-5, construct a boxplot for the rate of return.
(Essay)
4.8/5 (37)
You were told that the  quartiles of female students' weight at a major university are 95 lbs., 125 lbs., and 138 lbs...What percentage of the students weigh less than 95 lbs...?
(Short Answer)
4.8/5 (44)
SCENARIO 3-2 The data below represent the number of grams of carbohydrates in a serving of breakfast cereal in a sample of 11 different servings.
-Referring to Scenario 3-2, the interquartile range in the carbohydrate amounts is ________ grams.
(Short Answer)
4.8/5 (35)
SCENARIO 3-1 Health care issues are receiving much attention in both academic and political arenas.A sociologist recently conducted a survey of citizens over 60 years of age whose net worth is too high to qualify for Medicaid.The ages of 25 senior citizens were as follows:  -Referring to Scenario 3-1, calculate the coefficient of variation of the ages of the senior citizens.
(Short Answer)
4.7/5 (42)
The median of a data set with 20 items would be the average of the 10th and the 11th items in the ordered array.
(True/False)
4.9/5 (28)
SCENARIO 3-1 Health care issues are receiving much attention in both academic and political arenas.A sociologist recently conducted a survey of citizens over 60 years of age whose net worth is too high to qualify for Medicaid.The ages of 25 senior citizens were as follows:
-Referring to Scenario 3-1, calculate the standard deviation of the ages of the senior citizens correct to the nearest hundredth of a year.
(Short Answer)
4.8/5 (35)
The geometric mean is useful in measuring the rate of change of a variable over time.
(True/False)
4.8/5 (39)
In left-skewed distributions, the distance from the smallest value to Q₁ is greater than the distance from Q₃ to the largest value.
(True/False)
4.8/5 (45)
In a set of numerical data, the value for Q₂ is always halfway between Q₁ and Q₃.
(True/False)
4.9/5 (38)
SCENARIO 3-8 The period from 2010 to 2013 saw a great deal of volatility in the value of stocks.The data in the following table represent the total rate of return of our companies from 2010 to 2013. 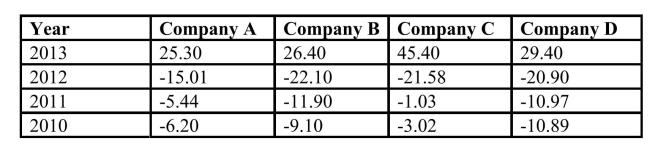 -Referring to Scenario 3-8, calculate the geometric mean rate of return per year for Company D.
(Short Answer)
4.7/5 (34)
Filters
- Essay(0)
- Multiple Choice(0)
- Short Answer(0)
- True False(0)
- Matching(0)