Exam 3: Numerical Descriptive Measures
Exam 1: Defining and Collecting Data207 Questions
Exam 2: Organizing and Visualizing Variables213 Questions
Exam 3: Numerical Descriptive Measures167 Questions
Exam 4: Basic Probability171 Questions
Exam 5: Discrete Probability Distributions217 Questions
Exam 6: The Normal Distributions and Other Continuous Distributions189 Questions
Exam 7: Sampling Distributions135 Questions
Exam 8: Confidence Interval Estimation189 Questions
Exam 9: Fundamentals of Hypothesis Testing: One-Sample Tests187 Questions
Exam 10: Two-Sample Tests208 Questions
Exam 11: Analysis of Variance216 Questions
Exam 12: Chi-Square and Nonparametric Tests178 Questions
Exam 13: Simple Linear Regression214 Questions
Exam 14: Introduction to Multiple Regression336 Questions
Exam 15: Multiple Regression Model Building99 Questions
Exam 16: Time-Series Forecasting173 Questions
Exam 17: Business Analytics115 Questions
Exam 18: A Roadmap for Analyzing Data329 Questions
Exam 19: Statistical Applications in Quality Management Online162 Questions
Exam 20: Decision Making Online129 Questions
Exam 21: Understanding Statistics: Descriptive and Inferential Techniques39 Questions
Select questions type
SCENARIO 3-5 The rate of return of a Fortune 500 company over the past 15 years are: 3.17%, 4.43%, 5.93%, 5.43%, 7.29%, 8.21%, 6.23%, 5.23%, 4.34%, 6.68%, 7.14%, -5.56%, -5.23%, -5.73%, -10.34%
-Referring to Scenario 3-5, compute the arithmetic mean rate of return per year.
(Short Answer)
4.9/5  (44)
(44)
If a set of data is perfectly symmetrical, the arithmetic mean must be identical to the median.
(True/False)
4.9/5 (28)
SCENARIO 3-4 The ordered array below represents the number of cargo manifests approved by customs inspectors of the Port of New York in a sample of 35 days:  Note: For this sample, the sum of the values is 838, and the sum of the squared differences between each value and the mean is 619.89.
-Referring to Scenario 3-4, the standard deviation of the customs data is ________.
Note: For this sample, the sum of the values is 838, and the sum of the squared differences between each value and the mean is 619.89.
-Referring to Scenario 3-4, the standard deviation of the customs data is ________.
(Short Answer)
4.9/5 (34)
SCENARIO 3-3 The ordered array below represents the number of vitamin supplements sold by a health food store in a sample of 16 days.  Note: For this sample, the sum of the values is 448, and the sum of the squared differences between each value and the mean is 812.
-Referring to Scenario 3-3, what type of shape does the distribution of the sample appear to have?
Note: For this sample, the sum of the values is 448, and the sum of the squared differences between each value and the mean is 812.
-Referring to Scenario 3-3, what type of shape does the distribution of the sample appear to have?
(Short Answer)
4.8/5 (35)
The line drawn within the box of the boxplot always represents the arithmetic mean.
(True/False)
4.8/5 (41)
SCENARIO 3-12 Given below are the rating and performance scores of 15 laptop computers. 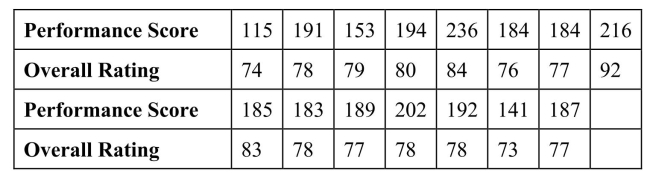 -Referring to Scenario 3-12, what is the sample covariance between the performance scores and the rating?
(Short Answer)
4.7/5 (44)
SCENARIO 3-4 The ordered array below represents the number of cargo manifests approved by customs inspectors of the Port of New York in a sample of 35 days: Note: For this sample, the sum of the values is 838, and the sum of the squared differences between each value and the mean is 619.89.
-Referring to Scenario 3-4, the arithmetic mean of the customs data is ________.
(Short Answer)
4.7/5 (35)
SCENARIO 3-12 Given below are the rating and performance scores of 15 laptop computers.
-Referring to Scenario 3-12, you will expect a decrease in the performance score of one laptop computer to be associated with
(Multiple Choice)
4.7/5 (41)
SCENARIO 3-7 In a recent academic year, many public universities in the United States raised tuition and fees due to a decrease in state subsidies.The change in the cost of tuition, a shared dormitory room, and the most popular meal plan from the previous academic year for a sample of 10 public universities were as follows: $1,589, $593, $1,223, $869, $423, $1,720, $708, $1425, $922 and $308.
-Referring to Scenario 3-7, what is the mean and median change in the cost?
(Short Answer)
4.9/5 (31)
In right-skewed distributions, the distance from Q₃ to the largest value is greater than the distance from the smallest observation to Q₁.
(True/False)
4.9/5 (38)
SCENARIO 3-2 The data below represent the number of grams of carbohydrates in a serving of breakfast cereal in a sample of 11 different servings. 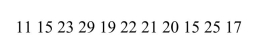 -Referring to Scenario 3-2, is the carbohydrate amount in the cereal right- or left-skewed?
(Short Answer)
4.9/5 (38)
SCENARIO 3-2 The data below represent the number of grams of carbohydrates in a serving of breakfast cereal in a sample of 11 different servings.
-Referring to Scenario 3-2, the first quartile of the carbohydrate amounts is ________ grams.
(Short Answer)
4.8/5 (43)
Which of the arithmetic mean, median, mode, and geometric mean are resistant measures of central tendency?
(Multiple Choice)
4.8/5 (28)
A boxplot is a graphical representation of a five-number summary.
(True/False)
4.8/5 (43)
SCENARIO 3-6 The rate of return of an Internet Service Provider over a 10-year period are: 10.25%, 12.64%, 8.37%, 9.29%, 6.23%, 42.53%, 29.23%, 15.25%, 21.52%, -2.35%.
-Referring to Scenario 3-6, what is the shape of the distribution for the rate of return?
(Short Answer)
4.8/5 (38)
SCENARIO 3-8 The period from 2010 to 2013 saw a great deal of volatility in the value of stocks.The data in the following table represent the total rate of return of our companies from 2010 to 2013. 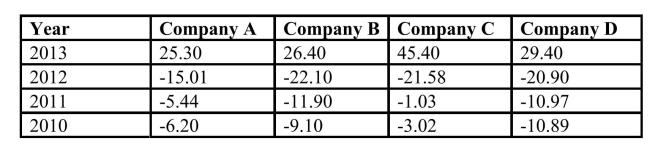 -Referring to Scenario 3-8, calculate the geometric mean rate of return per year for Company B.
(Short Answer)
4.9/5 (32)
SCENARIO 3-7 In a recent academic year, many public universities in the United States raised tuition and fees due to a decrease in state subsidies.The change in the cost of tuition, a shared dormitory room, and the most popular meal plan from the previous academic year for a sample of 10 public universities were as follows: $1,589, $593, $1,223, $869, $423, $1,720, $708, $1425, $922 and $308.
-Referring to Scenario 3-7, what is the coefficient of variation of the change in cost?
(Short Answer)
4.9/5 (33)
SCENARIO 3-6 The rate of return of an Internet Service Provider over a 10-year period are: 10.25%, 12.64%, 8.37%, 9.29%, 6.23%, 42.53%, 29.23%, 15.25%, 21.52%, -2.35%.
-Referring to Scenario 3-6, compute the geometric mean rate of return per year for the first three years.
(Short Answer)
4.9/5 (43)
SCENARIO 3-12 Given below are the rating and performance scores of 15 laptop computers.
-Referring to Scenario 3-12, how will you classify the linear relationship between the performance scores and the rating?
(Multiple Choice)
4.8/5 (33)
SCENARIO 3-11 Given below are the closing prices for the Dow Jones Industrial Average (DJIA)and the Standard & Poor's (S&P)500 Index over 10-weeks sometime in the past.  -Referring to Scenario 3-11, for the week when the DJIA is high, you will expect the
  index in that week to
(Multiple Choice)
4.8/5 (32)
Filters
- Essay(0)
- Multiple Choice(0)
- Short Answer(0)
- True False(0)
- Matching(0)