Exam 3: Numerical Descriptive Measures
Exam 1: Defining and Collecting Data207 Questions
Exam 2: Organizing and Visualizing Variables213 Questions
Exam 3: Numerical Descriptive Measures167 Questions
Exam 4: Basic Probability171 Questions
Exam 5: Discrete Probability Distributions217 Questions
Exam 6: The Normal Distributions and Other Continuous Distributions189 Questions
Exam 7: Sampling Distributions135 Questions
Exam 8: Confidence Interval Estimation189 Questions
Exam 9: Fundamentals of Hypothesis Testing: One-Sample Tests187 Questions
Exam 10: Two-Sample Tests208 Questions
Exam 11: Analysis of Variance216 Questions
Exam 12: Chi-Square and Nonparametric Tests178 Questions
Exam 13: Simple Linear Regression214 Questions
Exam 14: Introduction to Multiple Regression336 Questions
Exam 15: Multiple Regression Model Building99 Questions
Exam 16: Time-Series Forecasting173 Questions
Exam 17: Business Analytics115 Questions
Exam 18: A Roadmap for Analyzing Data329 Questions
Exam 19: Statistical Applications in Quality Management Online162 Questions
Exam 20: Decision Making Online129 Questions
Exam 21: Understanding Statistics: Descriptive and Inferential Techniques39 Questions
Select questions type
SCENARIO 3-1 Health care issues are receiving much attention in both academic and political arenas.A sociologist recently conducted a survey of citizens over 60 years of age whose net worth is too high to qualify for Medicaid.The ages of 25 senior citizens were as follows:  -Referring to Scenario 3-1 determine the third quartile of the ages of the senior citizens.
(Short Answer)
4.8/5  (34)
(34)
According to the Chebyshev rule, at least 93.75% of all observations in any data set are contained within how many standard deviations around the mean?
(Multiple Choice)
4.8/5 (41)
The interquartile range is a measure of variation or dispersion in a set of data.
(True/False)
4.9/5 (34)
SCENARIO 3-6 The rate of return of an Internet Service Provider over a 10-year period are: 10.25%, 12.64%, 8.37%, 9.29%, 6.23%, 42.53%, 29.23%, 15.25%, 21.52%, -2.35%.
-Referring to Scenario 3-6, construct a boxplot for the rate of return
(Essay)
4.8/5 (37)
SCENARIO 3-3 The ordered array below represents the number of vitamin supplements sold by a health food store in a sample of 16 days.  Note: For this sample, the sum of the values is 448, and the sum of the squared differences between each value and the mean is 812.
-Referring to Scenario 3-3, is the number of vitamin supplements sold in this sample leptokurtic or platykurtic?
Note: For this sample, the sum of the values is 448, and the sum of the squared differences between each value and the mean is 812.
-Referring to Scenario 3-3, is the number of vitamin supplements sold in this sample leptokurtic or platykurtic?
(Short Answer)
4.8/5 (30)
SCENARIO 3-3 The ordered array below represents the number of vitamin supplements sold by a health food store in a sample of 16 days. Note: For this sample, the sum of the values is 448, and the sum of the squared differences between each value and the mean is 812.
-Referring to Scenario 3-3, the variance of the number of vitamin supplements sold in this sample is ________.
(Short Answer)
4.8/5 (34)
SCENARIO 3-7 In a recent academic year, many public universities in the United States raised tuition and fees due to a decrease in state subsidies.The change in the cost of tuition, a shared dormitory room, and the most popular meal plan from the previous academic year for a sample of 10 public universities were as follows: $1,589, $593, $1,223, $869, $423, $1,720, $708, $1425, $922 and $308.
-Referring to Scenario 3-7, what is the skewness statistic of the change in the cost?
(Short Answer)
4.9/5 (40)
SCENARIO 3-2 The data below represent the number of grams of carbohydrates in a serving of breakfast cereal in a sample of 11 different servings. 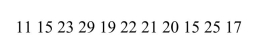 -Referring to Scenario 3-2, construct a boxplot for the carbohydrate amounts.
(Essay)
4.8/5 (39)
The line drawn within the box of the boxplot always represents the median.
(True/False)
4.9/5 (35)
SCENARIO 3-4 The ordered array below represents the number of cargo manifests approved by customs inspectors of the Port of New York in a sample of 35 days:  Note: For this sample, the sum of the values is 838, and the sum of the squared differences between each value and the mean is 619.89.
-Referring to Scenario 3-4, the variance of the customs data is ________.
Note: For this sample, the sum of the values is 838, and the sum of the squared differences between each value and the mean is 619.89.
-Referring to Scenario 3-4, the variance of the customs data is ________.
(Short Answer)
5.0/5 (45)
SCENARIO 3-2 The data below represent the number of grams of carbohydrates in a serving of breakfast cereal in a sample of 11 different servings.
-Referring to Scenario 3-2, the variance of the carbohydrate amounts is ________ (grams squared).
(Short Answer)
4.8/5 (37)
SCENARIO 3-7 In a recent academic year, many public universities in the United States raised tuition and fees due to a decrease in state subsidies.The change in the cost of tuition, a shared dormitory room, and the most popular meal plan from the previous academic year for a sample of 10 public universities were as follows: $1,589, $593, $1,223, $869, $423, $1,720, $708, $1425, $922 and $308.
-Referring to Scenario 3-7, what is the standard deviation of the change in the cost?
(Short Answer)
4.7/5 (33)
The 12-month rate of returns over a three-year period of a stock is 0.099, -0.289, and 0.089. The geometric mean rate of return per year for this stock is _______.
(Short Answer)
4.9/5 (30)
SCENARIO 3-5 The rate of return of a Fortune 500 company over the past 15 years are: 3.17%, 4.43%, 5.93%, 5.43%, 7.29%, 8.21%, 6.23%, 5.23%, 4.34%, 6.68%, 7.14%, -5.56%, -5.23%, -5.73%, -10.34%
-Referring to Scenario 3-5, what is the range of the rate of return?
(Short Answer)
4.9/5 (47)
In a perfectly symmetrical bell-shaped "normal" distribution
(Multiple Choice)
4.8/5 (47)
SCENARIO 3-9 The following table represents the assets in billions of dollars of the five largest bond funds sometime in the past. 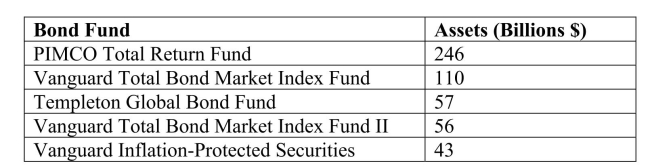 -Referring to Scenario 3-9, what are the variance and standard deviation for this population?
(Short Answer)
4.9/5 (40)
As a rule, a value is considered an extreme value if its Z score is less than 3.
(True/False)
4.8/5 (40)
SCENARIO 3-13 Energy drink consumption has continued to gain in popularity since the 1997 debut of Red Bull, the current leader in the energy drink market.Given below are the exam scores and the number of 12-ounce energy drinks consumed within a week prior to the exam of 10 college students. 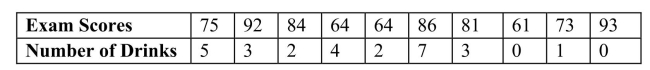 -Referring to Scenario 3-13, for a student who has consumed a high number of energy drinks within the week prior to the exam, you will expect his/her exam score to
(Multiple Choice)
4.9/5 (32)
Filters
- Essay(0)
- Multiple Choice(0)
- Short Answer(0)
- True False(0)
- Matching(0)