Exam 6: Data Mining
Exam 1: Introduction30 Questions
Exam 2: Descriptive Statistics60 Questions
Exam 3: Data Visualization61 Questions
Exam 4: Linear Regression60 Questions
Exam 5: Time Series Analysis and Forecasting58 Questions
Exam 6: Data Mining60 Questions
Exam 7: Spreadsheet Models60 Questions
Exam 8: Linear Optimization Models60 Questions
Exam 9: Integer Linear Optimization Models60 Questions
Exam 10: Nonlinear Optimization Models60 Questions
Exam 11: Monte Carlo Simulation59 Questions
Exam 12: Decision Analysis60 Questions
Select questions type
In which of the following data-mining process steps is the data manipulated to make it suitable for formal modeling?
(Multiple Choice)
4.8/5  (34)
(34)
The impurity of a group of observations is based on the variance of the outcome value for the observations in the group for _____.
(Multiple Choice)
4.8/5 (39)
A sample is representative of the entire data population only if it:
(Multiple Choice)
4.9/5 (38)
An analysis of items frequently co-occurring in transactions is known as _____.
(Multiple Choice)
4.8/5 (34)
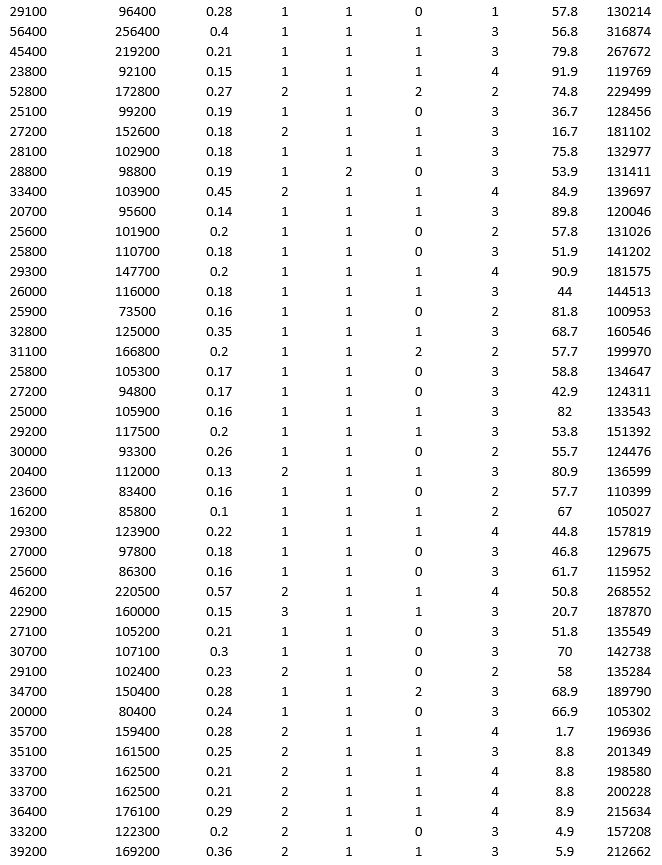
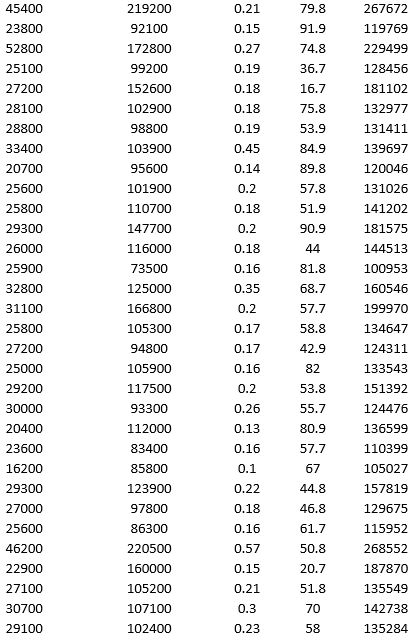
To examine the local housing market in a particular region, a sample of 120 homes sold during a year are collected. The data are given below:

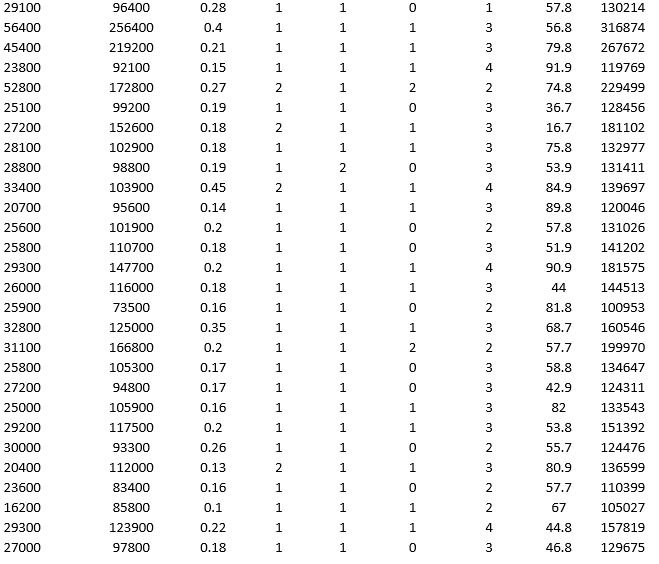
 Partition the data into training (50 percent), validation (30 percent), and test (20 percent) sets. Predict the sale price using a regression tree. Use Sale Price as the output variable and all the other variables as input variables. In Step 2 of XLMiner's Regression Tree procedure, be sure to Normalize input data, to set the Maximum #splits for input variables to 59, to set the Minimum #records in a terminal node to 1, and specify Using Best prune tree as the scoring option. In Step 3 of XLMiner's Regression Tree procedure, set the maximum number of levels to 7. Generate the Full tree and Best pruned tree.
a. In terms of number of decision nodes, compare the size of the full tree to the size of the best pruned tree.
b. What is the root mean squared error (RMSE) of the best pruned tree on the validation data and on the test data?
c. What is the average error on the validation data and test data? What does this suggest?
d. By examining the best pruned tree, what are the critical variables in predicting the sale price of a home?
Partition the data into training (50 percent), validation (30 percent), and test (20 percent) sets. Predict the sale price using a regression tree. Use Sale Price as the output variable and all the other variables as input variables. In Step 2 of XLMiner's Regression Tree procedure, be sure to Normalize input data, to set the Maximum #splits for input variables to 59, to set the Minimum #records in a terminal node to 1, and specify Using Best prune tree as the scoring option. In Step 3 of XLMiner's Regression Tree procedure, set the maximum number of levels to 7. Generate the Full tree and Best pruned tree.
a. In terms of number of decision nodes, compare the size of the full tree to the size of the best pruned tree.
b. What is the root mean squared error (RMSE) of the best pruned tree on the validation data and on the test data?
c. What is the average error on the validation data and test data? What does this suggest?
d. By examining the best pruned tree, what are the critical variables in predicting the sale price of a home?
(Essay)
4.9/5 (32)
Single linkage is a measure of calculating dissimilarity between clusters by:
(Multiple Choice)
5.0/5 (28)
Average linkage is a measure of calculating dissimilarity between clusters by:
(Multiple Choice)
4.9/5 (30)
_____ is a generalization of linear regression for predicting a categorical outcome variable.
(Multiple Choice)
4.7/5 (39)
A bank is interested in identifying different attributes of its customers and below is the sample data of 150 customers. In the data table for the dummy variable Gender, 0 represents Male and 1 represents Female. And for the dummy variable Personal loan, 0 represents a customer who has not taken personal loan and 1 represents a customer who has taken personal loan.

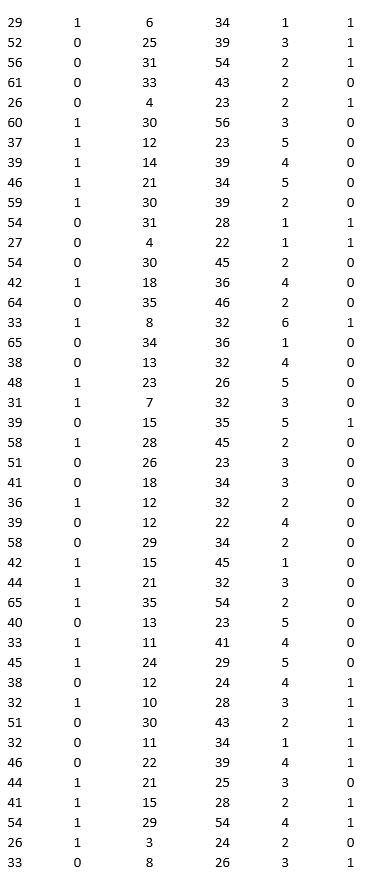
 Partition the data into training (50 percent), validation (30 percent), and test (20 percent) sets. Fit a classification tree using Age, Gender, Work experience, Income (in 1000 $), and Family size as input variables and Personal loan as the output variable. In Step 2 of XLMiner's Classification Tree procedure, be sure to Normalize input data and to set the Minimum #records in a terminal node to 1. In Step 3 of XLMiner's Classification Tree procedure, set the maximum number of levels to seven. Generate the Full tree, Best pruned tree, and Minimum error tree. Generate lift charts for both the validation data and the test data.
a. Interpret the set of rules implied by the best pruned tree that characterize the customers who have taken personal loan.
b. For the default cutoff value of 0.5, what is the overall error rate, Class 1 error rate, and Class 0 error rate of the best pruned tree on the test data? Interpret these respective measures.
c. Examine the decile-wise lift chart for the best pruned tree on the test data. What is the first decile lift? Interpret this value.
Partition the data into training (50 percent), validation (30 percent), and test (20 percent) sets. Fit a classification tree using Age, Gender, Work experience, Income (in 1000 $), and Family size as input variables and Personal loan as the output variable. In Step 2 of XLMiner's Classification Tree procedure, be sure to Normalize input data and to set the Minimum #records in a terminal node to 1. In Step 3 of XLMiner's Classification Tree procedure, set the maximum number of levels to seven. Generate the Full tree, Best pruned tree, and Minimum error tree. Generate lift charts for both the validation data and the test data.
a. Interpret the set of rules implied by the best pruned tree that characterize the customers who have taken personal loan.
b. For the default cutoff value of 0.5, what is the overall error rate, Class 1 error rate, and Class 0 error rate of the best pruned tree on the test data? Interpret these respective measures.
c. Examine the decile-wise lift chart for the best pruned tree on the test data. What is the first decile lift? Interpret this value.
(Essay)
4.8/5 (45)
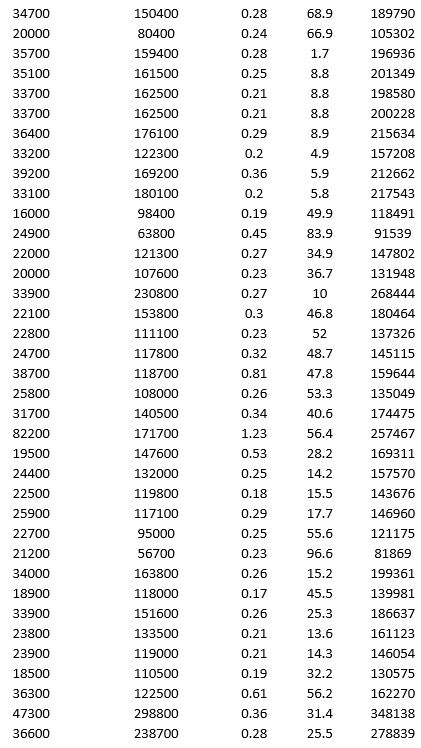
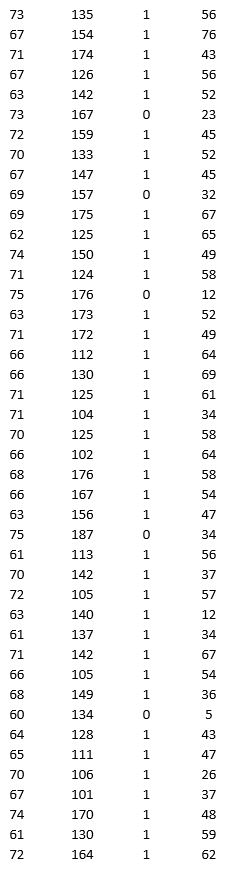
To examine the local housing market in a particular region, a sample of 120 homes sold during a year are collected. The data are given below:

 Partition the data into training (50 percent), validation (30 percent), and test (20 percent) sets. Predict the sale price using k-nearest neighbors with up to k = 10. Use Sale Price as the output variable and all the other variables as input variables. In Step 2 of XLMiner's k-Nearest Neighbors Prediction procedure, be sure to Normalize input data and to Score on best k between 1 and specified value. Generate a Detailed Scoring report for all three sets of data.
a. What value of k minimizes the root mean squared error (RMSE) on the validation data?
b. What is the RMSE on the validation data and test data?
c. What is the average error on the validation data and test data? What does this suggest?
Partition the data into training (50 percent), validation (30 percent), and test (20 percent) sets. Predict the sale price using k-nearest neighbors with up to k = 10. Use Sale Price as the output variable and all the other variables as input variables. In Step 2 of XLMiner's k-Nearest Neighbors Prediction procedure, be sure to Normalize input data and to Score on best k between 1 and specified value. Generate a Detailed Scoring report for all three sets of data.
a. What value of k minimizes the root mean squared error (RMSE) on the validation data?
b. What is the RMSE on the validation data and test data?
c. What is the average error on the validation data and test data? What does this suggest?
(Essay)
4.9/5 (27)
A cluster's _____ can be measured by the difference between the distance value at which a cluster is originally formed and the distance value at which it is merged with another cluster in a dendrogram.
(Multiple Choice)
4.7/5 (34)
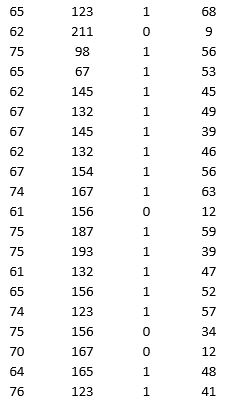
To examine the local housing market in a particular region, a sample of 120 homes sold during a year are collected. The data is given below.

 Apply hierarchical clustering with 10 clusters using LandValue ($), BuildingValue ($), Acres, Age, and Price ($) as variables. Be sure to Normalize input data in Step 2 of the XLMiner Hierarchical Clustering procedure. Use Ward's method as the clustering method. a. Use a PivotTable on the data in the HC_Clusters1 worksheet to compute the cluster centers for the clusters in the hierarchical clustering.
b. Identify the cluster with the largest average price. Using all the variables, how would you characterize this cluster?
c. Identify the smallest cluster.
Apply hierarchical clustering with 10 clusters using LandValue ($), BuildingValue ($), Acres, Age, and Price ($) as variables. Be sure to Normalize input data in Step 2 of the XLMiner Hierarchical Clustering procedure. Use Ward's method as the clustering method. a. Use a PivotTable on the data in the HC_Clusters1 worksheet to compute the cluster centers for the clusters in the hierarchical clustering.
b. Identify the cluster with the largest average price. Using all the variables, how would you characterize this cluster?
c. Identify the smallest cluster.
(Essay)
4.7/5 (32)
The endpoint of a k-means clustering algorithm occurs when:
(Multiple Choice)
4.8/5 (31)
_____ is a measure of calculating dissimilarity between clusters by considering only the two most dissimilar observations in the two clusters.
(Multiple Choice)
4.9/5 (40)
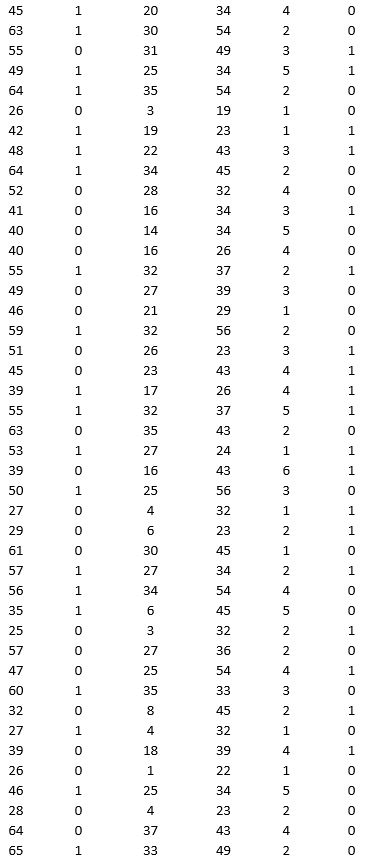
A research team wanted to assess the relationship between age, systolic blood pressure, smoking, and risk of stroke. A sample of 150 patients who had a stroke is selected and the data collected are given below. Here, for the variable Smoker, 1 represents smokers and 0 represents nonsmokers.

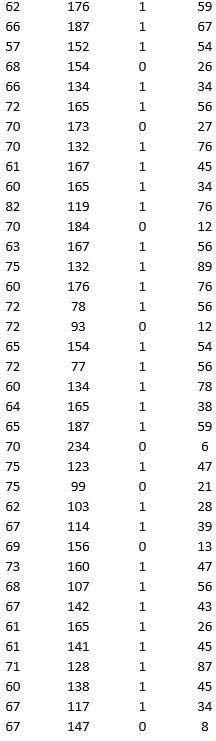
 Partition the data into training (50 percent), validation (30 percent), and test (20 percent) sets. Predict the Risk of stroke using k-nearest neighbors with up to k = 20. Use Risk as the output variable and all the other variables as input variables. In Step 2 of XLMiner's k-Nearest Neighbors Prediction procedure, be sure to Normalize input data and to Score on best k between 1 and specified value. Generate a Detailed Scoring report for all three sets of data.
a. What value of k minimizes the root mean squared error (RMSE) on the validation data?
b. What is the RMSE on the validation data and test data?
c. What is the average error on the validation data and test data? What does this suggest?
Partition the data into training (50 percent), validation (30 percent), and test (20 percent) sets. Predict the Risk of stroke using k-nearest neighbors with up to k = 20. Use Risk as the output variable and all the other variables as input variables. In Step 2 of XLMiner's k-Nearest Neighbors Prediction procedure, be sure to Normalize input data and to Score on best k between 1 and specified value. Generate a Detailed Scoring report for all three sets of data.
a. What value of k minimizes the root mean squared error (RMSE) on the validation data?
b. What is the RMSE on the validation data and test data?
c. What is the average error on the validation data and test data? What does this suggest?
(Essay)
4.8/5 (43)
Filters
- Essay(0)
- Multiple Choice(0)
- Short Answer(0)
- True False(0)
- Matching(0)