Exam 6: Data Mining
Exam 1: Introduction30 Questions
Exam 2: Descriptive Statistics60 Questions
Exam 3: Data Visualization61 Questions
Exam 4: Linear Regression60 Questions
Exam 5: Time Series Analysis and Forecasting58 Questions
Exam 6: Data Mining60 Questions
Exam 7: Spreadsheet Models60 Questions
Exam 8: Linear Optimization Models60 Questions
Exam 9: Integer Linear Optimization Models60 Questions
Exam 10: Nonlinear Optimization Models60 Questions
Exam 11: Monte Carlo Simulation59 Questions
Exam 12: Decision Analysis60 Questions
Select questions type
In which of the following scenarios would it be appropriate to use hierarchical clustering?
(Multiple Choice)
4.8/5  (30)
(30)
Jaccard's coefficient is different from the matching coefficient in that the:
(Multiple Choice)
4.9/5 (39)
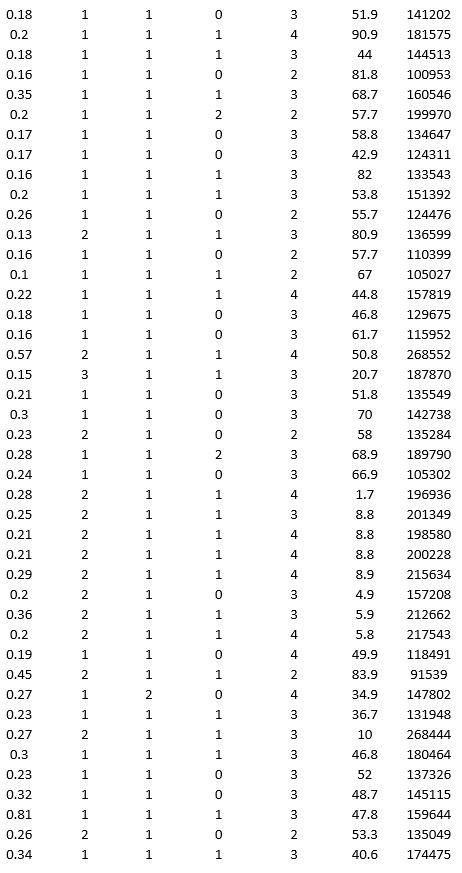
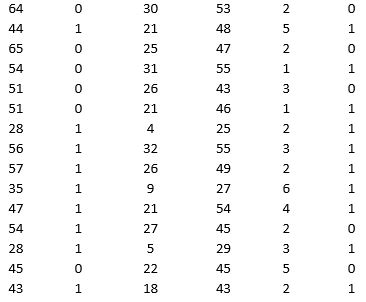
A bank is interested in identifying different attributes of its customers and below is the sample data of 150 customers. In the data table for the dummy variable Gender, 0 represents Male and 1 represents Female. And for the dummy variable Personal loan, 0 represents a customer who has not taken personal loan and 1 represents a customer who has taken personal loan.

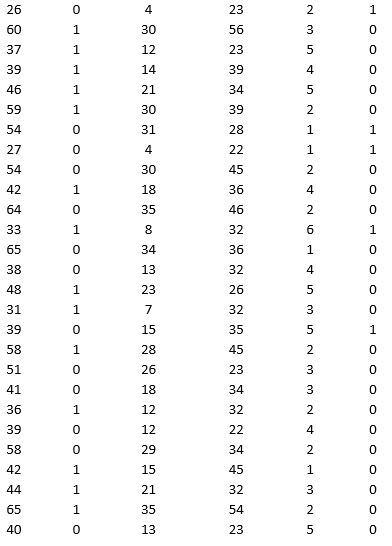
 Partition the data into training (50 percent), validation (30 percent), and test (20 percent) sets. Classify the data using k-nearest neighbors with up to k = 10. Use Age, Gender, Work experience, Income (in 1000 $), and Family size as input variables and Personal loan as the output variable. In Step 2 of XLMiner's k-nearest neighbors Classification procedure, be sure to Normalize input data and to Score on best k between 1 and specified value. Generate lift charts for both the validation data and test data.
a. For the cutoff probability value 0.5, what value of k minimizes the overall error rate on the validation data? Explain the difference in the overall error rate on the training, validation, and test data.
b. Examine the decile-wise lift chart on the test data. Identify and interpret the first decile lift.
c. For cutoff probability values of 0.5, 0.4, 0.3, and 0.2, what are the corresponding Class 1 error rates and Class 0 error rates on the validation data?
Partition the data into training (50 percent), validation (30 percent), and test (20 percent) sets. Classify the data using k-nearest neighbors with up to k = 10. Use Age, Gender, Work experience, Income (in 1000 $), and Family size as input variables and Personal loan as the output variable. In Step 2 of XLMiner's k-nearest neighbors Classification procedure, be sure to Normalize input data and to Score on best k between 1 and specified value. Generate lift charts for both the validation data and test data.
a. For the cutoff probability value 0.5, what value of k minimizes the overall error rate on the validation data? Explain the difference in the overall error rate on the training, validation, and test data.
b. Examine the decile-wise lift chart on the test data. Identify and interpret the first decile lift.
c. For cutoff probability values of 0.5, 0.4, 0.3, and 0.2, what are the corresponding Class 1 error rates and Class 0 error rates on the validation data?
(Essay)
4.9/5 (31)
_____ is a measure of the heterogeneity of observations in a classification tree.
(Multiple Choice)
4.8/5 (35)
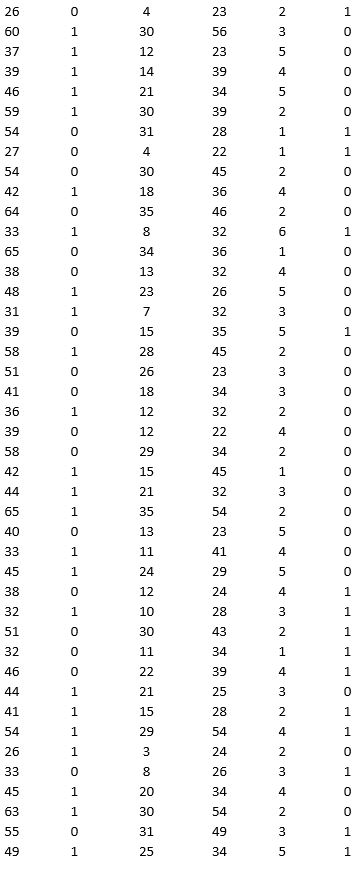
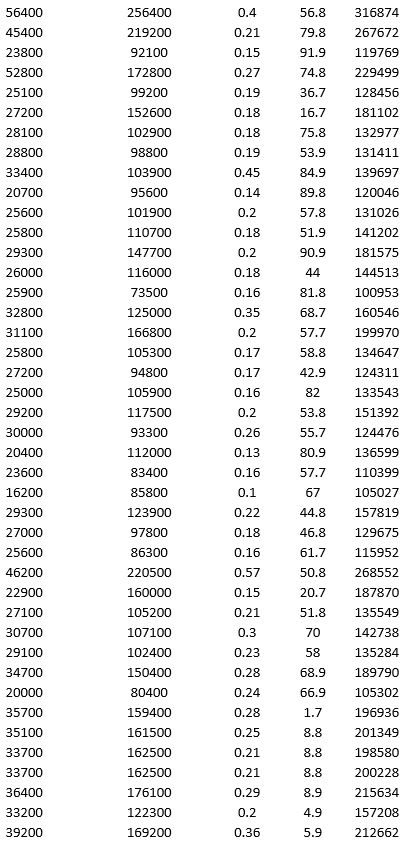
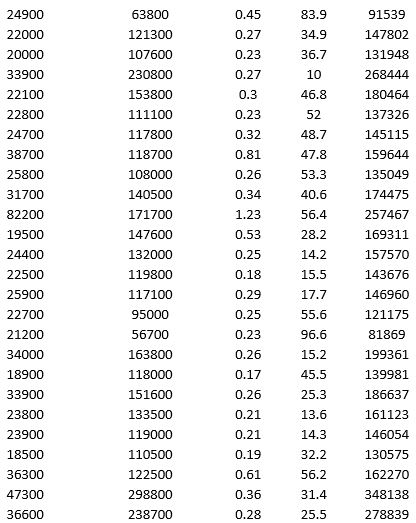
To examine the local housing market in a particular region, a sample of 120 homes sold during a year are collected. The data are given below:

 Partition the data into training (50 percent), validation (30 percent), and test (20 percent) sets. Predict the sale price using multiple linear regression. Use Sale Price as the output variable and all the other variables as input variables. To generate a pool of models to consider, execute the following steps. In Step 2 of XLMiner's Multiple Linear Regression procedure, click the Best subset option. In the Best Subset dialog box, check the box next to Perform best subset selection, enter 6 in the box next to Maximum size of best subset:, enter 1 in the box next to Number of best subsets:, and check the box next to Exhaustive search.
a. From the generated set of multiple linear regression models, select one that you believe is a good fit. Express the model as a mathematical equation relating the output variable to the input variables.
b. For your model, what is the RMSE on the validation data and test data?
c. What is the average error on the validation data and test data? What does this suggest?
Partition the data into training (50 percent), validation (30 percent), and test (20 percent) sets. Predict the sale price using multiple linear regression. Use Sale Price as the output variable and all the other variables as input variables. To generate a pool of models to consider, execute the following steps. In Step 2 of XLMiner's Multiple Linear Regression procedure, click the Best subset option. In the Best Subset dialog box, check the box next to Perform best subset selection, enter 6 in the box next to Maximum size of best subset:, enter 1 in the box next to Number of best subsets:, and check the box next to Exhaustive search.
a. From the generated set of multiple linear regression models, select one that you believe is a good fit. Express the model as a mathematical equation relating the output variable to the input variables.
b. For your model, what is the RMSE on the validation data and test data?
c. What is the average error on the validation data and test data? What does this suggest?
(Essay)
4.9/5 (40)
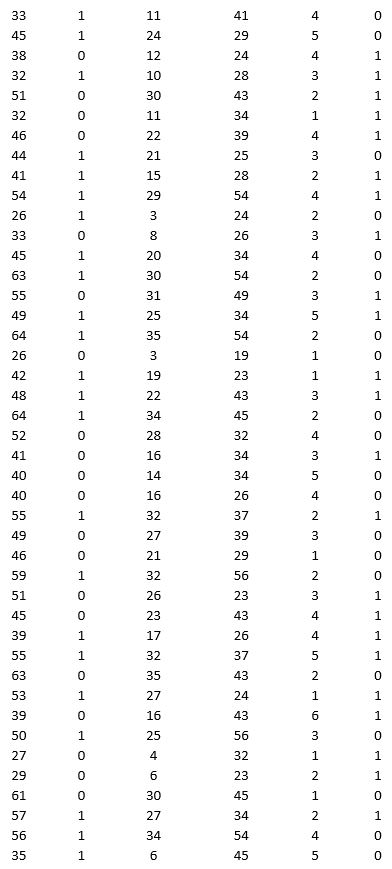
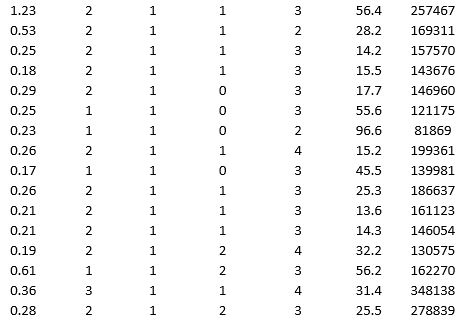
A bank is interested in identifying different attributes of its customers and below is the sample data of 150 customers. In the data table for the dummy variable Gender, 0 represents Male and 1 represents Female. And for the dummy variable Personal loan, 0 represents a customer who has not taken personal loan and 1 represents a customer who has taken personal loan.

 Partition the data into training (50 percent), validation (30 percent), and test (20 percent) sets. Use logistic regression to classify observations as Personal loan taken (or not taken) using Age, Gender, Work experience, Income (in 1000 $), and Family size as input variables and Personal loan as the output variable. Perform an exhaustive-search best subset selection with the number of best subsets equal to 2.
a. From the generated set of logistic regression models, select one that you believe is a good fit. Express the model as a mathematical equation relating the output variable to the input variables.
b. Increases in which variables increase the chance of a customer who has taken the personal loan? Increases in which variables decrease the chance of a customer who has not taken the personal loan?
c. Using the default cutoff value of 0.5 for your logistic regression model, what is the overall error rate on the test data?
Partition the data into training (50 percent), validation (30 percent), and test (20 percent) sets. Use logistic regression to classify observations as Personal loan taken (or not taken) using Age, Gender, Work experience, Income (in 1000 $), and Family size as input variables and Personal loan as the output variable. Perform an exhaustive-search best subset selection with the number of best subsets equal to 2.
a. From the generated set of logistic regression models, select one that you believe is a good fit. Express the model as a mathematical equation relating the output variable to the input variables.
b. Increases in which variables increase the chance of a customer who has taken the personal loan? Increases in which variables decrease the chance of a customer who has not taken the personal loan?
c. Using the default cutoff value of 0.5 for your logistic regression model, what is the overall error rate on the test data?
(Essay)
4.9/5 (39)
A _____ refers to the number of times that a collection of items occur together in a transaction data set.
(Multiple Choice)
4.7/5 (41)
An observation classified as part of a group with a characteristic when it actually does not have the characteristic is termed as a(n) _____.
(Multiple Choice)
4.7/5 (45)
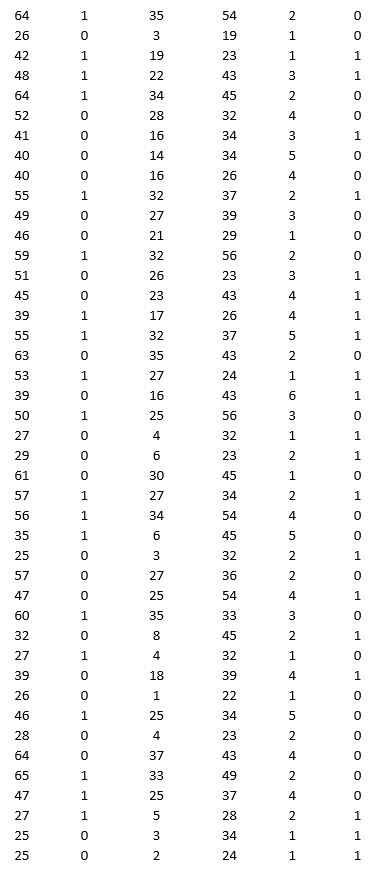
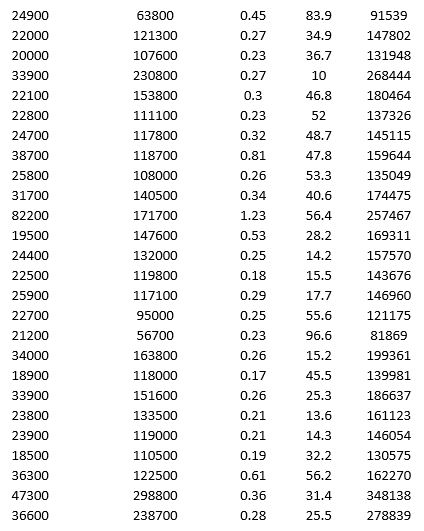
To examine the local housing market in a particular region, a sample of 120 homes sold during a year are collected. The data is given below.

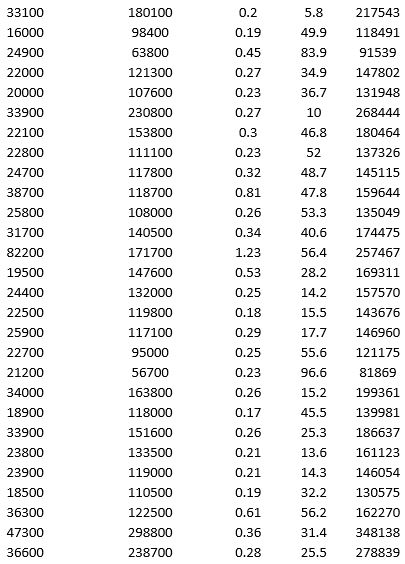 For the above data, apply k-means clustering using Price ($) as the variable with k = 3. Be sure to Normalize input data, and specify 50 iterations and 10 random starts in Step 2 of the XLMiner k-Means Clustering procedure. Then create one distinct data set for each of the three resulting clusters of price.
a. For the observations composing the cluster with low home price, apply hierarchical clustering with Ward's method to form three clusters using Acres and Age as variables. Be sure to Normalize input data in Step 2 of the XLMiner Hierarchical Clustering procedure. Using a PivotTable on the data in HC_Clusters1, report the characteristics of each cluster.
b. For the observations composing the cluster with medium home price, apply hierarchical clustering with Ward's method to form three clusters using Acres and Age as variables. Be sure to Normalize input data in Step 2 of the XLMiner Hierarchical Clustering procedure. Using a PivotTable on the data in HC_Clusters1, report the characteristics of each cluster.
c. Comment on the cluster with high home price.
For the above data, apply k-means clustering using Price ($) as the variable with k = 3. Be sure to Normalize input data, and specify 50 iterations and 10 random starts in Step 2 of the XLMiner k-Means Clustering procedure. Then create one distinct data set for each of the three resulting clusters of price.
a. For the observations composing the cluster with low home price, apply hierarchical clustering with Ward's method to form three clusters using Acres and Age as variables. Be sure to Normalize input data in Step 2 of the XLMiner Hierarchical Clustering procedure. Using a PivotTable on the data in HC_Clusters1, report the characteristics of each cluster.
b. For the observations composing the cluster with medium home price, apply hierarchical clustering with Ward's method to form three clusters using Acres and Age as variables. Be sure to Normalize input data in Step 2 of the XLMiner Hierarchical Clustering procedure. Using a PivotTable on the data in HC_Clusters1, report the characteristics of each cluster.
c. Comment on the cluster with high home price.
(Essay)
4.8/5 (34)
_____ can be used to partition observations in a manner to obtain clusters with the least amount of information loss due to the aggregation.
(Multiple Choice)
4.9/5 (40)
Separate error rates with respect to the false negative and false positive cases are computed to take into account the:
(Multiple Choice)
4.8/5 (34)
_____methods do not attempt to predict an output value but are rather used to detect patterns and relationships in the data.
(Multiple Choice)
4.8/5 (32)
The data preparation technique used in market segmentation to divide consumers into different homogeneous groups is _____.
(Multiple Choice)
4.9/5 (34)
To examine the local housing market in a particular region, a sample of 120 homes sold during a year are collected. The data is given below.

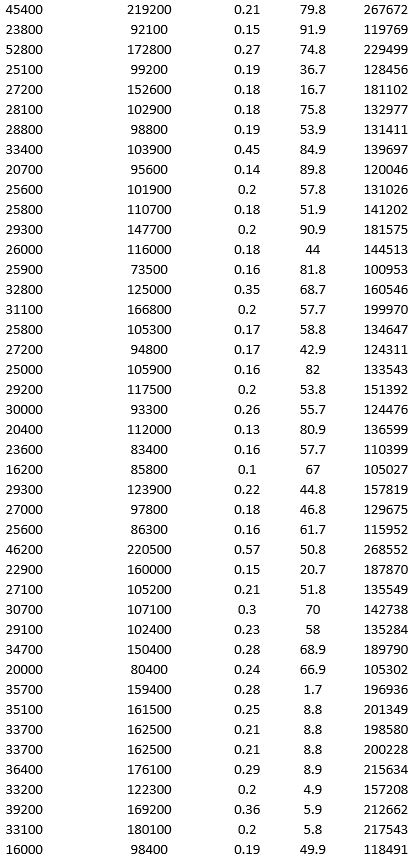
 a. Apply hierarchical clustering with 10 clusters using LandValue ($), BuildingValue ($), Acres, Age, and Price ($) as variables. Be sure to Normalize input data in Step 2 of the XLMiner Hierarchical Clustering procedure, and specify complete linkage as the clustering method. Analyze the resulting clusters by computing the cluster size. It may be helpful to use a PivotTable on the data in the HC_Clusters worksheet generated by XLMiner. You can also visualize the clusters by creating a scatter plot with Acre as the x-variable and Price ($) as the y-variable.
b. Repeat part a using average group linkage as the clustering method. Compare the clusters to the previous method.
a. Apply hierarchical clustering with 10 clusters using LandValue ($), BuildingValue ($), Acres, Age, and Price ($) as variables. Be sure to Normalize input data in Step 2 of the XLMiner Hierarchical Clustering procedure, and specify complete linkage as the clustering method. Analyze the resulting clusters by computing the cluster size. It may be helpful to use a PivotTable on the data in the HC_Clusters worksheet generated by XLMiner. You can also visualize the clusters by creating a scatter plot with Acre as the x-variable and Price ($) as the y-variable.
b. Repeat part a using average group linkage as the clustering method. Compare the clusters to the previous method.
(Essay)
4.9/5 (38)
A tree diagram used to illustrate the sequence of nested clusters produced by hierarchical clustering is known as a _____.
(Multiple Choice)
4.9/5 (40)
Which of the following methods is used by the analyst to decide if a particular variable needs to be retained in the sample during the sampling process?
(Multiple Choice)
4.8/5 (37)
To examine the local housing market in a particular region, a sample of 120 homes sold during a year is collected. The data are given below.

 Apply k-means clustering with k = 10 using LandValue ($), BuildingValue ($), Acres, Age, and Price ($) as variables. Be sure to Normalize input data, and specify 50 iterations and 10 random starts in Step 2 of the XLMiner k-Means Clustering procedure. What is the smallest cluster? What is the least dense cluster (as measured by the average distance in the cluster)?
(Essay)
4.8/5 (40)
_____ is the process of estimating the value of a categorical outcome variable.
(Multiple Choice)
4.8/5 (41)
Which of the following is a commonly used supervised learning method?
(Multiple Choice)
4.9/5 (27)
Which of the following reasons is responsible for the increase in the use of data-mining techniques in business?
(Multiple Choice)
4.8/5 (33)
Filters
- Essay(0)
- Multiple Choice(0)
- Short Answer(0)
- True False(0)
- Matching(0)