Exam 2: Functions and Graphs
Exam 1: Linear Equations and Graphs59 Questions
Exam 2: Functions and Graphs178 Questions
Exam 3: Mathematics of Finance57 Questions
Exam 4: Systems of Linear Equations; Matrices115 Questions
Exam 5: Linear Inequalities and Linear Programming26 Questions
Exam 6: Linear Programming: The Simplex Method58 Questions
Exam 7: Logic, Sets, and Counting51 Questions
Exam 8: Probability59 Questions
Exam 9: Markov Chains60 Questions
Exam 10: Data Description and Probability Distributions65 Questions
Exam 11: Games and Decisions52 Questions
Exam 12: Appendix A: Basic Algebra Review45 Questions
Exam 13: Appendix B: Special Topics20 Questions
Select questions type
Graph the function using a calculator and point-by-point plotting. Indicate increasing and decreasing intervals:
-f(x) = 3 ln x 
(Multiple Choice)
4.8/5  (36)
(36)
Use a calculator to evaluate the expression. Round the result to five decimal places:
-log 51.237
(Multiple Choice)
4.7/5 (39)
Graph the function using a calculator and point-by-point plotting. Indicate increasing and decreasing intervals:
-f(x) = 4 - ln x 
(Multiple Choice)
5.0/5 (34)
Assume it costs 25 cents to mail a letter weighing one ounce or less, and then 20 cents for each additional ounce or fraction of an ounce. Let L(x) be the cost of mailing a letter weighing x ounces. Graph y = L(x). Use the interval (0, 4].
(Multiple Choice)
4.8/5 (34)
The function F described by F(x) = 2.75x + 71.48 can be used to estimate the height, in centimeters, of a woman whose humerus (the bone from the elbow to the shoulder) is x cm long. Estimate the height of a woman whose humerus is  long. Round your answer to the nearest four decimal places.
(Multiple Choice)
4.8/5 (36)
Determine whether the function is linear, constant, or neither:
-
(Multiple Choice)
4.9/5 (27)
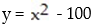
For the polynomial function find the following: (i) Degree of the polynomial; (ii) All x intercepts; (iii) The y intercept.
-
(Multiple Choice)
4.9/5 (30)
Hi-Tech UnWater begins a cable TV advertising campaign in Miami to market a new water. The percentage of the target market that buys water is estimated by the function 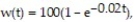 t represents the number of days of the campaign. After how long will 90% of the target market have bought the water?
(Multiple Choice)
4.8/5 (36)
Write an equation for the graph in the form y = a + k, where a is either 1 or -1 and h and k are integers:
-
(Multiple Choice)
4.9/5 (34)
The U. S. Census Bureau compiles data on population. The population (in thousands) of a southern city can be approximated by 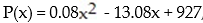 where x corresponds to the years after 1950. In what calendar year was the population about 804,200?
(Multiple Choice)
4.7/5 (25)
In the table below, the amount of the U.S. minimum wage is listed for selected years.

 Find an exponential regression model of the form y = a ∙
  , where y represents the U.S. minimum wage x years after 1960. Round a and b to four decimal places. According to this model, what will the minimum wage be in 2005? In 2010?
(Short Answer)
4.9/5 (31)
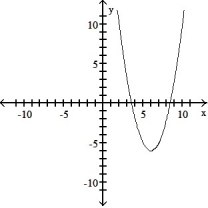
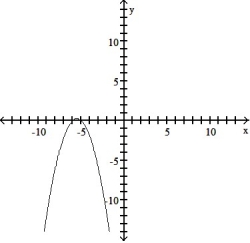
Write an equation for the lowest-degree polynomial function with the graph and intercepts shown in the figure:
-
(Multiple Choice)
4.8/5 (32)
Filters
- Essay(0)
- Multiple Choice(0)
- Short Answer(0)
- True False(0)
- Matching(0)