Exam 2: Functions and Graphs
Exam 1: Linear Equations and Graphs59 Questions
Exam 2: Functions and Graphs178 Questions
Exam 3: Mathematics of Finance57 Questions
Exam 4: Systems of Linear Equations; Matrices115 Questions
Exam 5: Linear Inequalities and Linear Programming26 Questions
Exam 6: Linear Programming: The Simplex Method58 Questions
Exam 7: Logic, Sets, and Counting51 Questions
Exam 8: Probability59 Questions
Exam 9: Markov Chains60 Questions
Exam 10: Data Description and Probability Distributions65 Questions
Exam 11: Games and Decisions52 Questions
Exam 12: Appendix A: Basic Algebra Review45 Questions
Exam 13: Appendix B: Special Topics20 Questions
Select questions type
Graph the function using a calculator and point-by-point plotting. Indicate increasing and decreasing intervals:
-f(x) = 2 - ln(x + 4) 
(Multiple Choice)
4.9/5  (39)
(39)
A carbon-14 dating test is performed on a fossil bone, and analysis finds that 15.5% of the original amount of carbon-14 is still present in the bone. Estimate the age of the fossil bone. (Recall that carbon-14 decays according to the equation 
(Multiple Choice)
4.7/5 (26)
The financial department of a company that manufactures portable MP3 players arrived at the following daily cost equation for manufacturing x MP3 players per day: 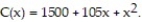 The average cost per unit at a production level of players per day is
  (A) Find the rational function
  .(B) Graph the average cost function on a graphing utility for 10 ≤ x ≤ 200.(C) Use the appropriate command on a graphing utility to find the daily production level (to the nearest integer) at which the average cost per player is a minimum. What is the minimum average cost (to the nearest cent)?
(Short Answer)
4.8/5 (35)
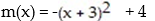
For the given function, find each of the following:
(A) Intercepts
(B) Vertex
(C) Maximum or minimum
(D) Range
-
(Multiple Choice)
4.9/5 (36)
Use the REGRESSION feature on a graphing calculator:
-The average retail price in the Spring of 2000 for a used Camaro Z28 coupe depends on the age of the car as shown in the following table.
 Find the quadratic model that best estimates this data. Round your answer to whole numbers.
(Multiple Choice)
4.9/5 (30)
An initial investment of $12,000 is invested for 2 years in an account that earns 4% interest, compounded quarterly. Find the amount of money in the account at the end of the period.
(Multiple Choice)
4.8/5 (48)
Suppose the cost per ton, y, to build an oil platform of x thousand tons is approximated by  What is the cost per ton for
(Multiple Choice)
4.7/5 (29)
Use the properties of logarithms to solve:
-log (x + 10) - log (x + 4) = log x
(Multiple Choice)
4.8/5 (40)
For the polynomial function find the following: (i) Degree of the polynomial; (ii) All x intercepts; (iii) The y intercept.
-y = 8x + 5
(Multiple Choice)
4.9/5 (43)
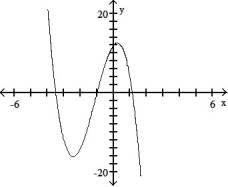
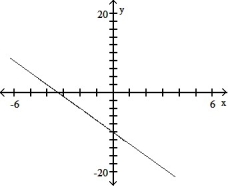
The graph that follows is the graph of a polynomial function. (i) What is the minimum degree of a polynomial function that could have the graph? (ii) Is the leading coefficient of the polynomial negative or positive?
-
(Multiple Choice)
4.8/5 (34)
The graph that follows is the graph of a polynomial function. (i) What is the minimum degree of a polynomial function that could have the graph? (ii) Is the leading coefficient of the polynomial negative or positive?
-
(Multiple Choice)
4.9/5 (28)
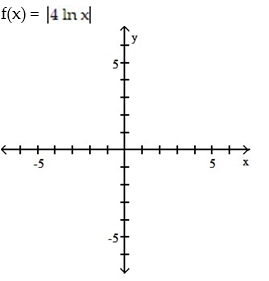
Graph the function using a calculator and point-by-point plotting. Indicate increasing and decreasing intervals:
-
(Multiple Choice)
4.8/5 (26)
Use the REGRESSION feature on a graphing calculator:
-Since 1984 funeral directors have been regulated by the Federal Trade Commission. The average cost of a funeral for an adult in a Midwest city has increased, as shown in the following table. 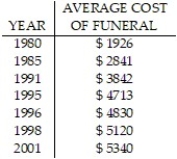 Let x represent the number of years since 1980. Use a graphing calculator to fit a quartic function to the data. Round your answer to five decimal places.
(Multiple Choice)
4.8/5 (37)
Filters
- Essay(0)
- Multiple Choice(0)
- Short Answer(0)
- True False(0)
- Matching(0)