Exam 2: Functions and Graphs
Exam 1: Linear Equations and Graphs59 Questions
Exam 2: Functions and Graphs178 Questions
Exam 3: Mathematics of Finance57 Questions
Exam 4: Systems of Linear Equations; Matrices115 Questions
Exam 5: Linear Inequalities and Linear Programming26 Questions
Exam 6: Linear Programming: The Simplex Method58 Questions
Exam 7: Logic, Sets, and Counting51 Questions
Exam 8: Probability59 Questions
Exam 9: Markov Chains60 Questions
Exam 10: Data Description and Probability Distributions65 Questions
Exam 11: Games and Decisions52 Questions
Exam 12: Appendix A: Basic Algebra Review45 Questions
Exam 13: Appendix B: Special Topics20 Questions
Select questions type
Solve graphically to two decimal places using a graphing calculator:
-
(Multiple Choice)
4.7/5  (32)
(32)
The function M described by M(x) = 2.89x + 70.64 can be used to estimate the height, in centimeters, of a male whose humerus (the bone from the elbow to the shoulder) is x cm long. Estimate the height of a male whose humerus is  long. Round your answer to the nearest four decimal places.
(Multiple Choice)
4.8/5 (35)
The population P, in thousands, of Fayetteville is given by P(t) =  , where t is the time, in months. Find the population at 9 months.
(Multiple Choice)
4.8/5 (37)
Use the REGRESSION feature on a graphing calculator:
-The total cost of the Democratic and the Republican national conventions has increased 596% over the 20-year period between 1980 and 2004. The following table lists the total cost, in millions of dollars, for selected years. 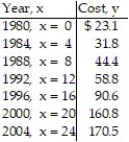 Find the exponential functions that best estimates this data. Round your answer to four decimal places
(Multiple Choice)
4.9/5 (35)
Use a calculator to evaluate the expression. Round the result to five decimal places:
-log 0.234
(Multiple Choice)
4.8/5 (38)
Find the vertex form for the quadratic function. Then find each of the following:
(A) Intercepts
(B) Vertex
(C) Maximum or minimum
(D) Range
-
(Multiple Choice)
4.8/5 (37)
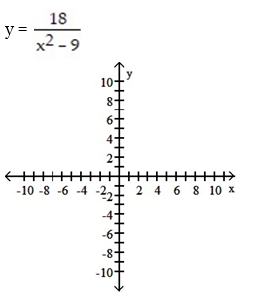
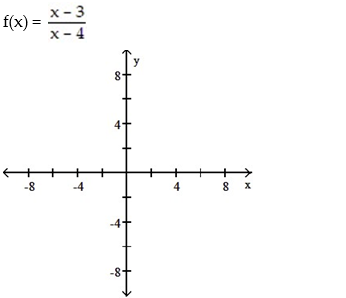
For the rational function below (i) Find any intercepts for the graph; (ii) Find any vertical and horizontal asymptotes for the graph; (iii) Sketch any asymptotes as dashed lines. Then sketch a graph of f.
-
(Multiple Choice)
4.8/5 (26)
Use the REGRESSION feature on a graphing calculator:
-As the number of farms has decreased in South Carolina, the average size of the remaining farms has grown larger, as shown below.
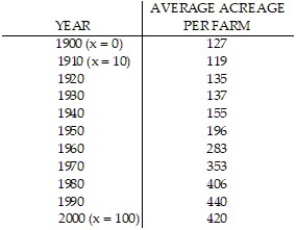 Let x represent the number of years since 1900. Use a graphing calculator to fit a quadratic function to the data. Round your answer to five decimal places.
(Multiple Choice)
4.8/5 (38)
Determine whether the relation represents a function. If it is a function, state the domain and range.
-{( -2, 2), ( -1, -1), (0, -2), ( 1, -1), ( 3, 7)}
(Multiple Choice)
4.9/5 (28)
Use point-by-point plotting to sketch the graph of the equation.
-y = x + 3 
(Multiple Choice)
4.9/5 (28)
Graph  and indicate the maximum or minimum value of f(x), whichever exists.
(Short Answer)
4.8/5 (37)
The average weight of a particular species of frog is given by w(x) = 98  , 0.1 x 0.3, where x is length (with legs stretched out) in meters and w(x) is weight in grams. (i) Describe how the graph of function w can be obtained from one of the six basic functions: y = x,
  ,
,  y =
y =  , y =
, y =  , or y =
  . (ii) Sketch a graph of function w using part (i) as an aid.
(Multiple Choice)
4.9/5 (30)
For the rational function below (i) Find the intercepts for the graph; (ii) Determine the domain; (iii) Find any vertical or horizontal asymptotes for the graph; (iv) Sketch any asymptotes as dashed lines. Then sketch the graph of y = f(x).
-
(Multiple Choice)
4.9/5 (37)
Filters
- Essay(0)
- Multiple Choice(0)
- Short Answer(0)
- True False(0)
- Matching(0)