Exam 4: Describing the Relation Between Two Variables
Exam 1: Data Collection34 Questions
Exam 2: Organizing and Summarizing Data30 Questions
Exam 3: Numerically Summarizing Data66 Questions
Exam 4: Describing the Relation Between Two Variables92 Questions
Exam 5: Probability91 Questions
Exam 6: Discrete Probability Distributions32 Questions
Exam 7: The Normal Probability Distributions36 Questions
Exam 8: Sampling Distributions12 Questions
Exam 9: Estimating the Value of a Parameter Using Confidence Intervals24 Questions
Exam 10: Hypothesis Tests Regarding a Parameter36 Questions
Exam 11: Inference on Two Samples65 Questions
Exam 12: Inference on Categorical Data16 Questions
Exam 13: Comparing Three or More Means15 Questions
Exam 14: Inference of the Least-Squares Regression Model28 Questions
Select questions type
A calculus instructor is interested in finding the strength of a relationship between the final exam grades of students enrolled in Calculus I and Calculus II at his college. The data (in percentages) are listed below. 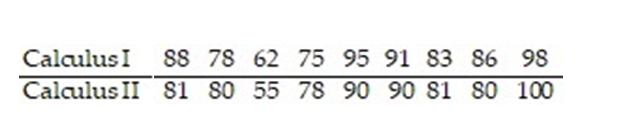 a) Graph a scatter diagram of the data.
b) Find an equation of the regression line.
c) Predict a Calculus II exam score for a student who receives an 80 in Calculus I.
a) Graph a scatter diagram of the data.
b) Find an equation of the regression line.
c) Predict a Calculus II exam score for a student who receives an 80 in Calculus I.
(Essay)
4.9/5  (33)
(33)
In a comprehensive road test on all new car models, one variable measured is the time it takes a car to accelerate from 0 to 60 miles per hour. To model acceleration time, a regression analysis is conducted on a random sample of 129 new cars. 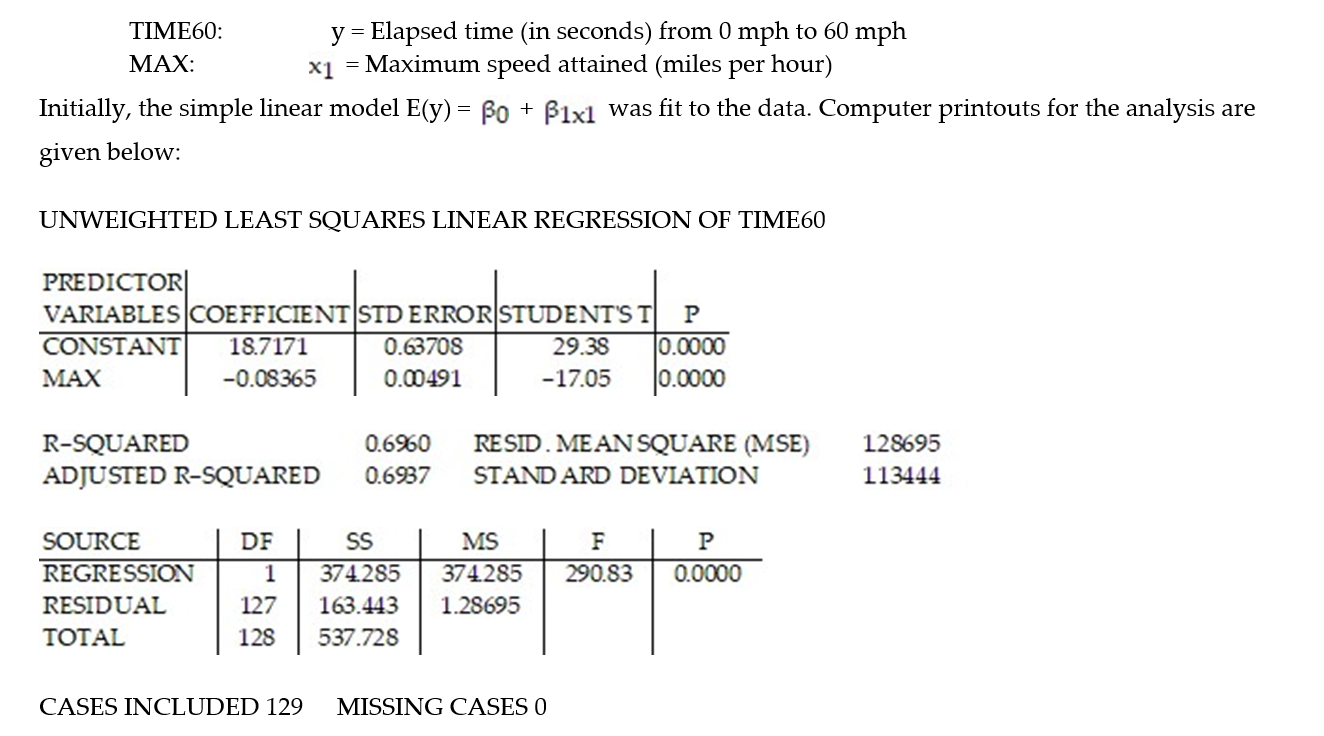 Approximately what percentage, rounded to the nearest whole percent, of the sample variation in acceleration time can be explained by the simple linear model?
(Multiple Choice)
4.9/5 (35)
The regression line for the given data is  = -0.206x + 2.097. Determine the residual of a data point for which x = 0 and y = 5.
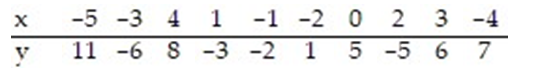
(Multiple Choice)
4.8/5 (43)
A company encourages applications from minority groups who they feel are under-represented in the company. The table shows the number of applications that were accepted last year from people belonging to minority groups and the number of applications that were accepted from people not belonging to minority groups. Only applications from well qualified applicants are included in the analysis.
(a) Does the acceptance rate appear to be higher for those belonging to minority groups or for those not belonging to minority groups ? Why? 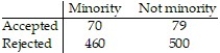 The data in the table do not take into account the department of the company. The data shown in the next table show the number of applications accepted from each group within each department.Department A Department B Department C
 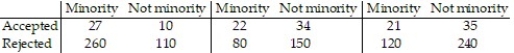 (b) Determine the proportion of minority applications that were accepted within department A. Determine the proportion of non-minority applications that were accepted within department A.
(c) Repeat part (b) for departments B and C to create a conditional distribution of acceptance rate by group for each department of the company.
(d) Write a short report detailing and explaining your findings.
(b) Determine the proportion of minority applications that were accepted within department A. Determine the proportion of non-minority applications that were accepted within department A.
(c) Repeat part (b) for departments B and C to create a conditional distribution of acceptance rate by group for each department of the company.
(d) Write a short report detailing and explaining your findings.
(Essay)
4.8/5 (25)
Find the equation of the regression line for the given data. Round values to the nearest thousandth. 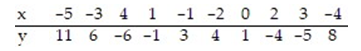
(Multiple Choice)
4.8/5 (38)
In an area of the Great Plains, records were kept on the relationship between the rainfall (in inches) and the yield of wheat (bushels per acre). Which is the best predicted value for y given x = 18.1? 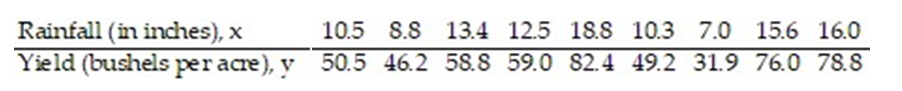
(Multiple Choice)
4.9/5 (49)
The regression line for the given data is  = -2.75x + 96.14. Determine the residual of a data point for which x = 0 and y = 98.
(Multiple Choice)
4.9/5 (28)
In a comprehensive road test on all new car models, one variable measured is the time it takes a car to accelerate from 0 to 60 miles per hour. To model acceleration time, a regression analysis is conducted on a random sample of 129 new cars.
TIME60: y = Elapsed time (in seconds) from 0 mph to 60 mph
MAX:  = Maximum speed attained (miles per hour)
Initially, the simple linear model E(y) =
= Maximum speed attained (miles per hour)
Initially, the simple linear model E(y) =  +
+ 
 was fit to the data. Computer printouts for the analysis are given below:
 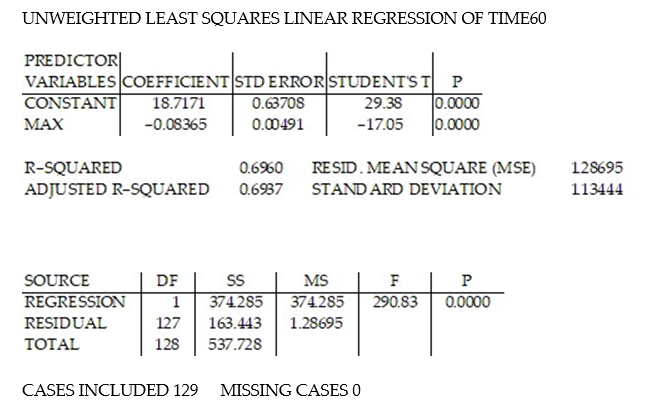 Find and interpret the estimate
  in the printout above.
(Essay)
5.0/5 (38)
The regression line for the given data is  = 0.449x - 30.27. Determine the residual of a data point for which x = 100 and y = 15.
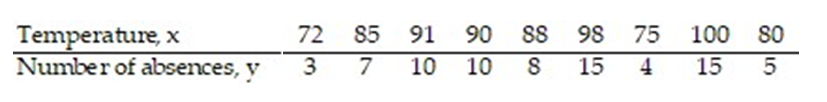
(Multiple Choice)
4.7/5 (31)
Use the regression equation to predict the value of y for x = -1.1. 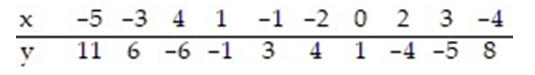
(Multiple Choice)
4.8/5 (32)
Compute the sum of the squared residuals of the least-squares line for the given data. 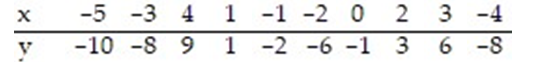
(Multiple Choice)
4.9/5 (33)
Construct a scatter diagram for the data.
-In order for employees of a company to work in a foreign office, they must take a test in the language of the country where they plan to work. The data below show the relationship between the number of years that employees have studied a particular language and the grades they received on the proficiency exam. 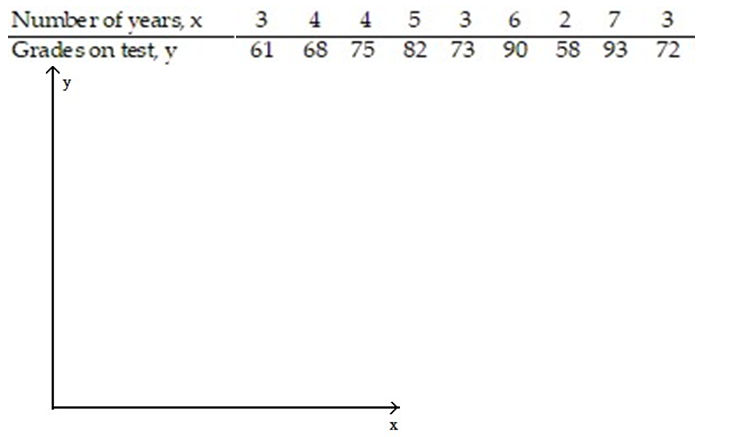
(Essay)
4.9/5 (39)
Construct a relative frequency marginal distribution for the given contingency table. Round valuese to the nearest thousandth. 
(Multiple Choice)
4.8/5 (24)
The dean of the Business School at a small Florida college wishes to determine whether the grade-point average (GPA) of a graduating student can be used to predict the graduate's starting salary. More specifically, the dean wants to know whether higher GPA's lead to higher starting salaries. Records for 23 of last year's Business School graduates are selected at random, and data on GPA (x) and starting salary (y, in $thousands) for each graduate were used to fit the model, E(y) =  +
+  x. The results of the simple linear regression are provided below.
(Multiple Choice)
5.0/5 (30)
A company keeps extensive records on its new salespeople on the premise that sales should increase with experience. A random sample of seven new salespeople produced the data on experience and sales shown in the table. 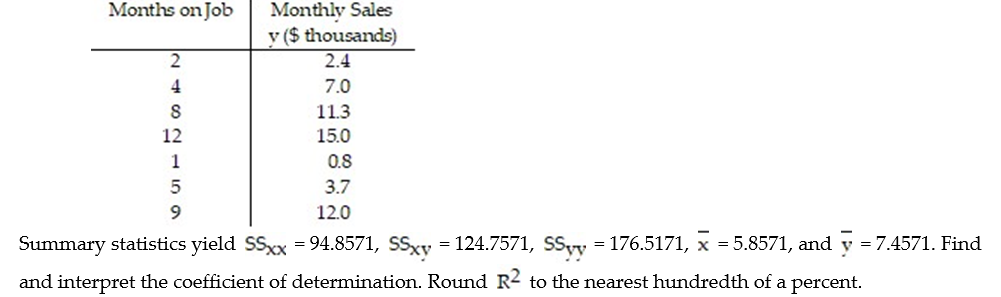
(Essay)
4.9/5 (28)
Make a scatter diagram for the data. Use the scatter diagram to describe how, if at all, the variables are related.
-
(Multiple Choice)
4.8/5 (42)
Researchers conducted a study to determine which of two different treatments, A or B, is more effective in the treatment of atherosclerosis. The results of their experiment are given in the table.
(a) Which treatment appears to be more effective? Why? 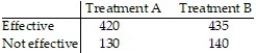 The data in the table do not take into account the seriousness of the case. The data shown in the next table show the effectiveness of each treatment for both mild and advanced cases of atherosclerosis.Mild Advancedatherosclerosis atherosclerosis
 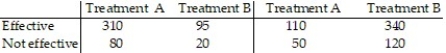 (b) Determine the proportion of mild cases of atherosclerosis that were effectively dealt with using treatment A. Determine the proportion of mild cases of atherosclerosis that were effectively dealt with using treatment B.
(c) Repeat part (b) for advanced cases of atherosclerosis to create a conditional distribution of effectiveness by treatment for each category of the disease.
(d) Write a short report detailing and explaining your findings.
(b) Determine the proportion of mild cases of atherosclerosis that were effectively dealt with using treatment A. Determine the proportion of mild cases of atherosclerosis that were effectively dealt with using treatment B.
(c) Repeat part (b) for advanced cases of atherosclerosis to create a conditional distribution of effectiveness by treatment for each category of the disease.
(d) Write a short report detailing and explaining your findings.
(Essay)
4.9/5 (37)
A manager wishes to determine the relationship between the number of years her sales representatives have been employed by the firm and their amount of sales (in thousands of dollars) per month. Find the equation of the regression line for the given data. What would be the predicted sales if the sales representative was employed by the firm for 30 years Is this reasonable? Why or why not? Round the regression line values to the nearest hundredth. 
(Multiple Choice)
4.8/5 (32)
The data below are the number of absences and the final grades of 9 randomly selected students from a literature class. Find the equation of the regression line for the given data. What would be the predicted final grade if a student was absent 14 times? Round the regression line values to the nearest hundredth. Round the predicted grade to the nearest whole number. 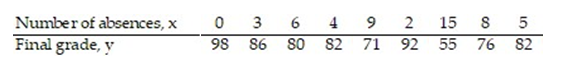
(Multiple Choice)
4.8/5 (32)
Filters
- Essay(0)
- Multiple Choice(0)
- Short Answer(0)
- True False(0)
- Matching(0)