Exam 4: Describing the Relation Between Two Variables
Exam 1: Data Collection34 Questions
Exam 2: Organizing and Summarizing Data30 Questions
Exam 3: Numerically Summarizing Data66 Questions
Exam 4: Describing the Relation Between Two Variables92 Questions
Exam 5: Probability91 Questions
Exam 6: Discrete Probability Distributions32 Questions
Exam 7: The Normal Probability Distributions36 Questions
Exam 8: Sampling Distributions12 Questions
Exam 9: Estimating the Value of a Parameter Using Confidence Intervals24 Questions
Exam 10: Hypothesis Tests Regarding a Parameter36 Questions
Exam 11: Inference on Two Samples65 Questions
Exam 12: Inference on Categorical Data16 Questions
Exam 13: Comparing Three or More Means15 Questions
Exam 14: Inference of the Least-Squares Regression Model28 Questions
Select questions type
A manager wishes to determine the relationship between the number of miles traveled (in hundreds of miles) by her sales representatives and their amount of sales (in thousands of dollars) per month. Find the equation of the regression line for the given data. What would be the predicted sales if the sales representative traveled 0 miles? Is this reasonable? Why or why not? Round the regression line values to the nearest hundredth. 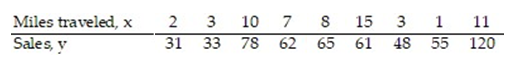
(Multiple Choice)
4.8/5  (41)
(41)
The coefficient of correlation between x and y is r = 0.59. Calculate the coefficient of determination  . Round
  to the nearest hundredth.
(Multiple Choice)
4.8/5 (35)
Civil engineers often use the straight-line equation,  =
=  +
+  x, to model the relationship between the mean shear strength of masonry joints and precompression stress, x. To test this theory, a series of stress tests were performed on solid bricks arranged in triplets and joined with mortar. The precompression stress was varied for each triplet and the ultimate shear load just before failure (called the shear strength) was recorded. The stress results for n = 7 triplet tests is shown in the accompanying table followed by a SAS printout of the regression analysis.
 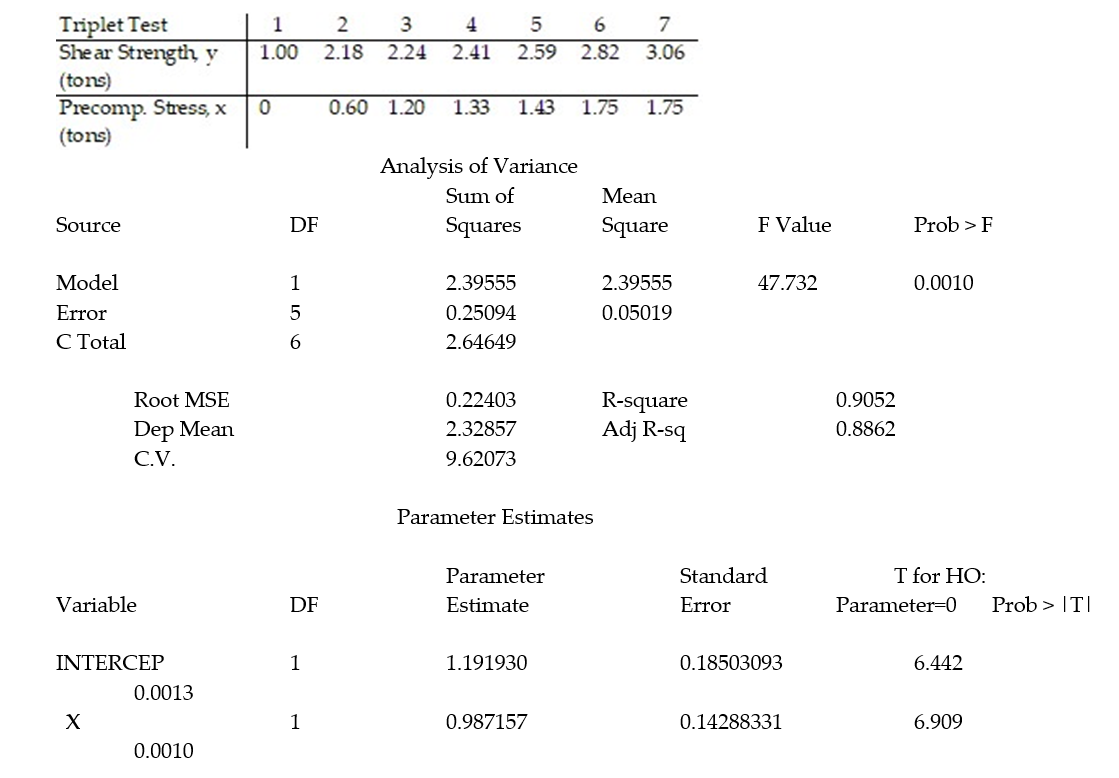 - Give a practical interpretation of the estimate of the y-intercept of the least squares line.
(Multiple Choice)
4.9/5 (24)
The regression line for the given data is  = 3.53x + 37.92. Determine the residual of a data point for which x = 8 and y = 65.
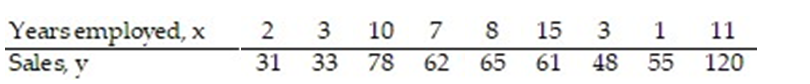
(Multiple Choice)
4.8/5 (41)
The following data represent the living situation of newlyweds in a large metropolitan area and their annual household income. Find the marginal frequency for newlyweds who live with family. 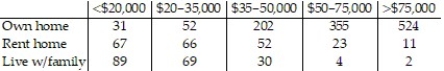
(Multiple Choice)
4.9/5 (34)
Use the linear correlation coefficient given to determine the coefficient of determination ,  -r = 0.32
(Multiple Choice)
4.8/5 (29)
Construct a scatter diagram for the data.
-Five brands of cigarettes were tested for the amounts of tar and nicotine they contained. All measurements are in milligrams per cigarette. 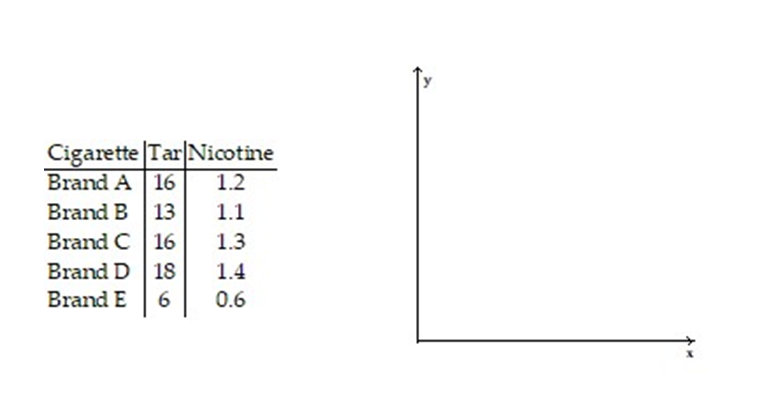
(Essay)
4.8/5 (35)
In a study of feeding behavior, zoologists recorded the number of grunts of a warthog feeding by a lake in a 15 minute time period following the addition of food. The data showing the weekly number of grunts and the age of the warthog (in days) are listed below. Compute the sum of the squared residuals of the least squared line for the given data. 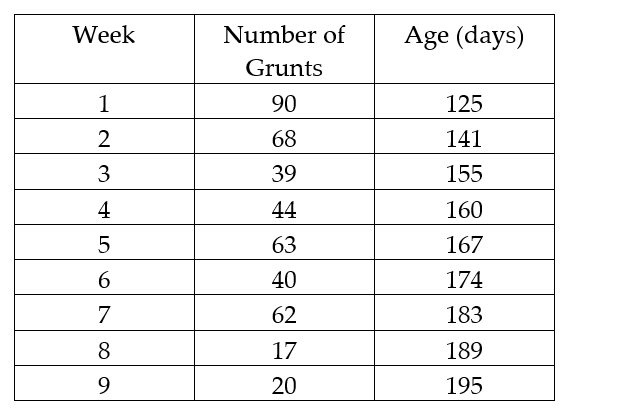
(Multiple Choice)
4.8/5 (34)
The regression line for the given data is  = 2.097x - 0.552. Determine the residual of a data point for which x = 3 and y = 6.
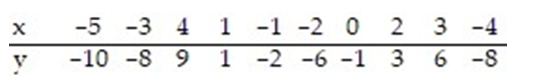
(Multiple Choice)
4.8/5 (34)
In an area of Russia, records were kept on the relationship between the rainfall (in inches) and the yield of wheat (bushels per acre). The data for a 9 year period is as follows:  The equation of the line of least squares is given as
  = -9.12 + 4.38x.
-What would be the expected number of inches of rain if the yield is 60 bushels of wheat per acre?
= -9.12 + 4.38x.
-What would be the expected number of inches of rain if the yield is 60 bushels of wheat per acre?
(Multiple Choice)
4.9/5 (29)
A county real estate appraiser wants to develop a statistical model to predict the appraised value of houses in a section of the county called East Meadow. One of the many variables thought to be an important predictor of appraised value is the number of rooms in the house. Consequently, the appraiser decided to fit the simple linear regression model,  where y = appraised value of the house (in $thousands) and x = number of rooms. Using data collected for a sample of n= 74 houses in East Meadow, the following results were obtained:
 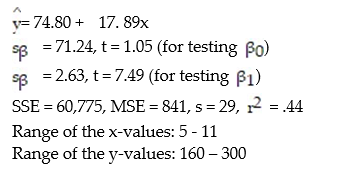 Give a practical interpretation of the estimate of the slope of the least squares line.
(Multiple Choice)
4.9/5 (30)
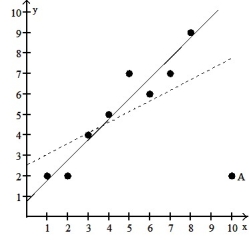
A scatter diagram is given with one of the points labeled "A." In addition, there are two least-squares regression lines drawn. The solid line excludes the point A. The dashed line includes the point A. Based on the graph, is the point A influential?
-
(True/False)
4.9/5 (31)
Filters
- Essay(0)
- Multiple Choice(0)
- Short Answer(0)
- True False(0)
- Matching(0)