Exam 4: Describing the Relation Between Two Variables
Exam 1: Data Collection34 Questions
Exam 2: Organizing and Summarizing Data30 Questions
Exam 3: Numerically Summarizing Data66 Questions
Exam 4: Describing the Relation Between Two Variables92 Questions
Exam 5: Probability91 Questions
Exam 6: Discrete Probability Distributions32 Questions
Exam 7: The Normal Probability Distributions36 Questions
Exam 8: Sampling Distributions12 Questions
Exam 9: Estimating the Value of a Parameter Using Confidence Intervals24 Questions
Exam 10: Hypothesis Tests Regarding a Parameter36 Questions
Exam 11: Inference on Two Samples65 Questions
Exam 12: Inference on Categorical Data16 Questions
Exam 13: Comparing Three or More Means15 Questions
Exam 14: Inference of the Least-Squares Regression Model28 Questions
Select questions type
Find the equation of the regression line for the given data. Round values to the nearest thousandth. 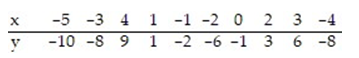
(Multiple Choice)
4.8/5  (37)
(37)
The regression line for the given data is  = -1.885x + 0.758. Determine the residual of a data point for which x = 4 and y = -6.
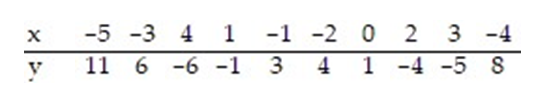
(Multiple Choice)
4.8/5 (40)
Given the equation of a regression line is  = -5.5x - 0.7, what is the best predicted value for y given x= 7.4?
(Multiple Choice)
4.9/5 (29)
Use the scatter diagrams shown, labeled a through f to solve the problem.
-In which scatter diagram is r = 0.01? 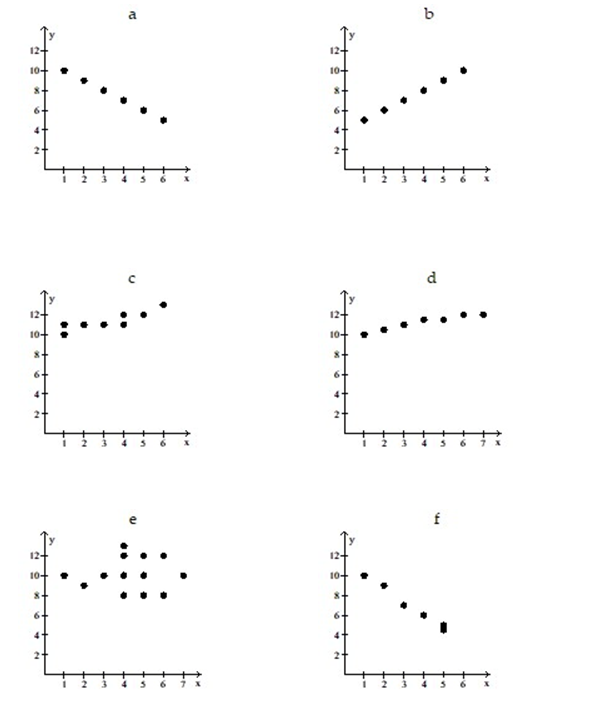
(Multiple Choice)
4.8/5 (24)
A traffic officer is compiling information about the relationship between the hour or the day and the speed over the limit at which the motorist is ticketed. He computes a correlation coefficient of 0.12. What does this tell the officer?
(Multiple Choice)
4.7/5 (34)
Make a scatter diagram for the data. Use the scatter diagram to describe how, if at all, the variables are related.
-
(Multiple Choice)
5.0/5 (31)
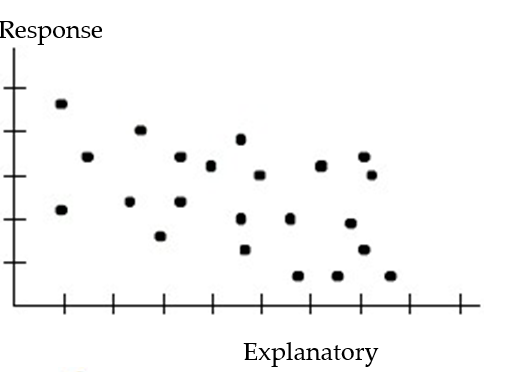
Choose the coefficient of determination that matches the scatterplot. Assume that the scales on the horizontal and vertical axes are the same.
-
(Multiple Choice)
4.8/5 (41)
The regression line for the given data is  = 4.379x + 4.267. Determine the residual of a data point for which x = 10.5 and y = 50.5.
(Multiple Choice)
5.0/5 (38)
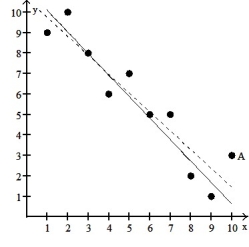
A scatter diagram is given with one of the points labeled "A." In addition, there are two least-squares regression lines drawn. The solid line excludes the point A. The dashed line includes the point A. Based on the graph, is the point A influential?
-
(True/False)
4.8/5 (32)
To investigate the relationship between yield of potatoes, y, and level of fertilizer application, x, an experimenter divides a field into eight plots of equal size and applies differing amounts of fertilizer to each. The yield of potatoes (in pounds) and the fertilizer application (in pounds) are recorded for each plot. The data are as follows: 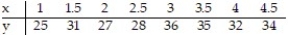 Summary statistics yield SSxx = 10.5, SSyy = 112, and SSxy = 25. Calculate the coefficient of determination rounded to the nearest ten-thousandth.
(Essay)
4.9/5 (38)
The data below are the average one-way commute times (in minutes) for selected students and the number of absences for those students during the term. Find the equation of the regression line for the given data. What would be the predicted number of absences if the commute time was 95 minutes? Is this a reasonable question? Round the predicted number of absences to the nearest whole number. Round the regression line values to the nearest hundredth. 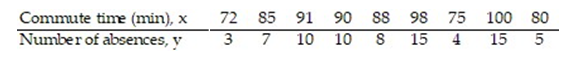
(Multiple Choice)
4.8/5 (33)
Each year a nationally recognized publication conducts its "Survey of America's Best Graduate and Professional Schools." An academic advisor wants to predict the typical starting salary of a graduate at a top business school using GMAT score of the school as a predictor variable. Total GMAT scores range from 200 to 800. A simple linear regression of SALARY versus GMAT using 25 data points shown below. 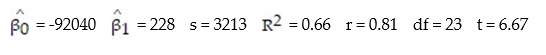 -Give a practical interpretation of
  = -92040.
(Multiple Choice)
4.9/5 (40)
In a study of feeding behavior, zoologists recorded the number of grunts of a warthog feeding by a lake in the 15 minute period following the addition of food. The data showing the weekly number of grunts and the age of the warthog (in days) are listed below: 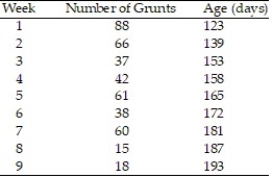 a. Write the equation of a straight-line model relating number of grunts (y) to age (x).
b. Give the least squares prediction equation.
c. Give a practical interpretation of the value of
a. Write the equation of a straight-line model relating number of grunts (y) to age (x).
b. Give the least squares prediction equation.
c. Give a practical interpretation of the value of  if possible.
d. Give a practical interpretation of the value of
if possible.
d. Give a practical interpretation of the value of  if possible.
(Essay)
4.9/5 (41)
Each year a nationally recognized publication conducts its "Survey of America's Best Graduate and Professional Schools." An academic advisor wants to predict the typical starting salary of a graduate at a top business school using GMAT score of the school as a predictor variable. A simple linear regression of SALARY versus GMAT using 25 data points shown below. 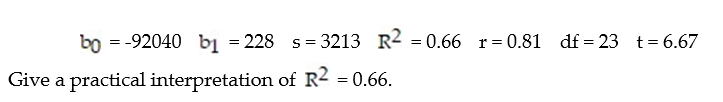
(Multiple Choice)
4.9/5 (33)
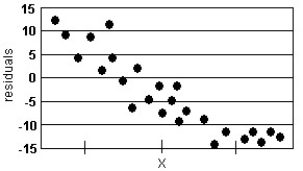
Analyze the residual lot below. Does it violate any of the conditions for an adequate linear model?
-
(Multiple Choice)
4.8/5 (29)
The data below are the average one-way commute times (in minutes) for selected students and the number of absences for those students during the term. Find the equation of the regression line for the given data. What would be the predicted number of absences if the commute time was 40 minutes? Is this a reasonable question? Round the predicted number of absences to the nearest whole number. Round the regression line values to the nearest hundredth. 
(Multiple Choice)
4.8/5 (41)
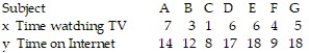
Construct a scatter diagram for the data.
-The data below are the number of absences and the final grades of 9 randomly selected students from a literature class. 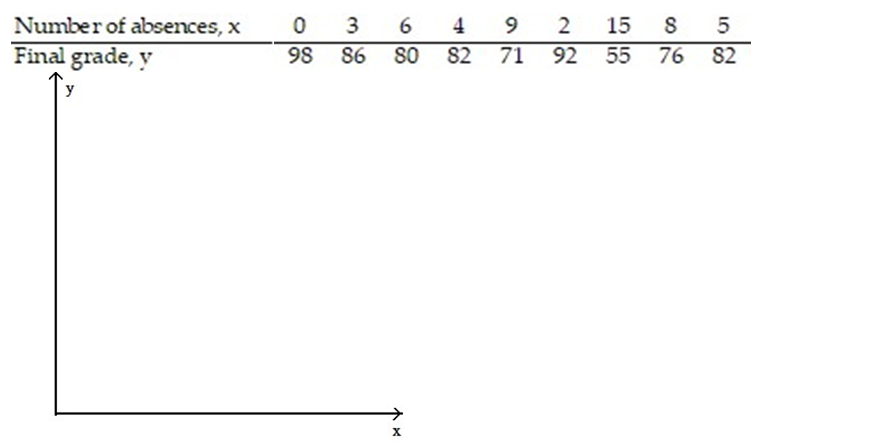
(Essay)
5.0/5 (32)
Calculate the linear correlation coefficient for the data below. 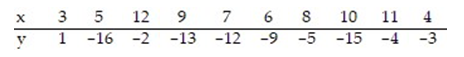
(Multiple Choice)
4.9/5 (31)
A manufacturer of boiler drums wants to use regression to predict the number of man-hours needed to erect drums in the future. The manufacturer collected a random sample of 35 boilers and measured the following two variables: 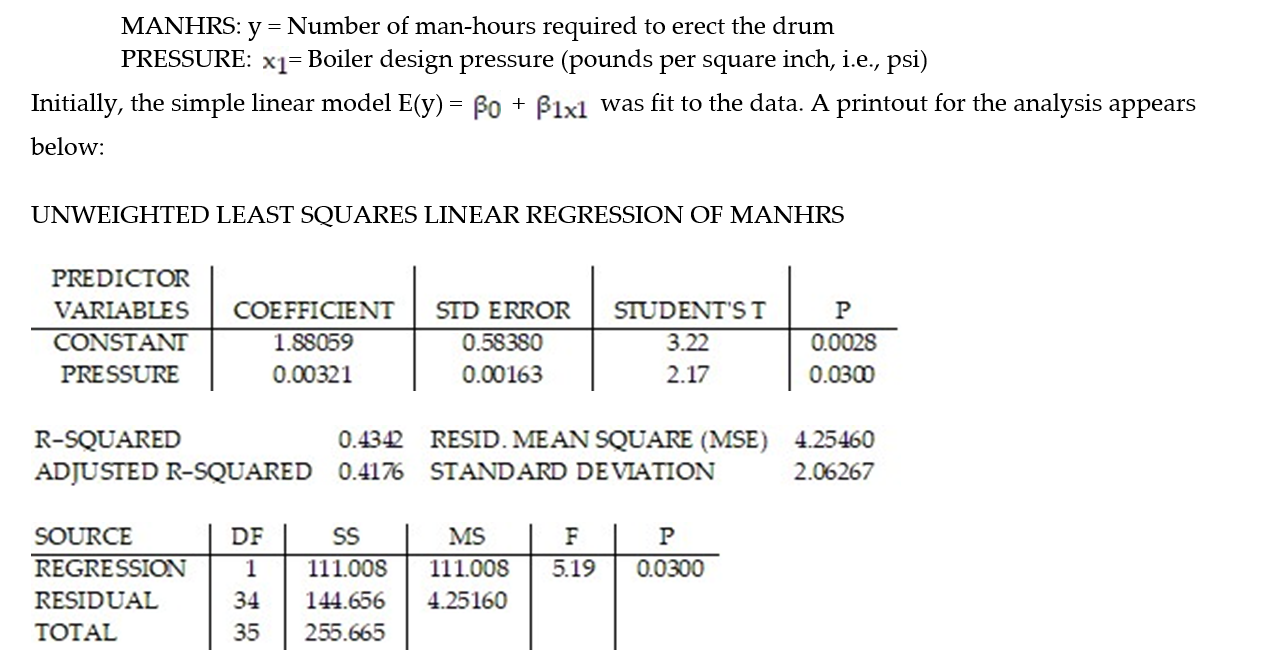 Give a practical interpretation of the coefficient of determination,
  . Express
  to the nearest whole percent.
(Multiple Choice)
4.7/5 (31)
Civil engineers often use the straight-line equation,  =
=  +
+  x, to model the relationship between the mean shear strength of masonry joints and precompression stress, x. To test this theory, a series of stress tests were performed on solid bricks arranged in triplets and joined with mortar. The precompression stress was varied for each triplet and the ultimate shear load just before failure (called the shear strength) was recorded. The stress results for n = 7 triplet tests is shown in the accompanying table followed by a SAS printout of the regression analysis.
 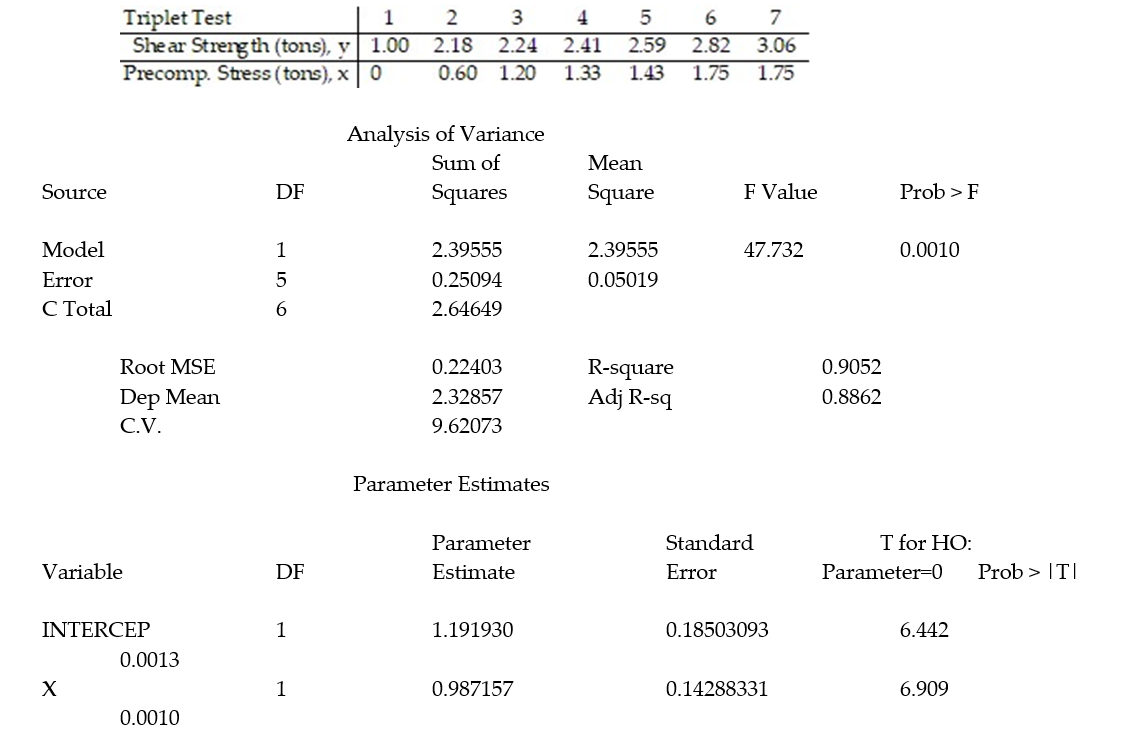 -Give a practical interpretation of the estimate of the slope of the least squares line.
(Multiple Choice)
4.9/5 (30)
Filters
- Essay(0)
- Multiple Choice(0)
- Short Answer(0)
- True False(0)
- Matching(0)