Exam 11: Two Quantitative Variables
Exam 1: Preliminaries: Introduction to Statistical Investigations46 Questions
Exam 2: Significance: How Strong Is the Evidence75 Questions
Exam 3: Generalization: How Broadly Do the Results Apply64 Questions
Exam 4: Estimation: How Large Is the Effect61 Questions
Exam 5: Causation: Can We Say What Caused the Effect30 Questions
Exam 6: Comparing Two Proportions46 Questions
Exam 7: Comparing Two Means46 Questions
Exam 8: Paired Data: One Quantitative Variable48 Questions
Exam 9: Comparing More Than Two Proportions46 Questions
Exam 10: Comparing More Than Two Means28 Questions
Exam 11: Two Quantitative Variables73 Questions
Exam 12: Modeling Randomness129 Questions
Select questions type
A student in an AP Statistics class decided to conduct a study to determine whether you could predict the number of followers a teen has on Instagram based on the number of people he or she is following. To do this, she randomly selected fifty students from her high school that had Instagram accounts and for each student recorded the number of people they were following and the number of followers they had. A scatterplot of the data is shown.
The regression line is
.
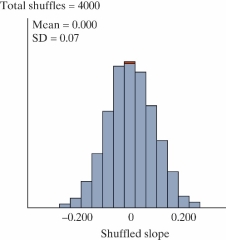
followers=-45.3+1.21(following) 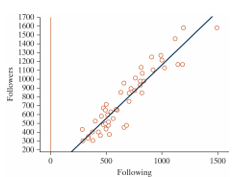 -We want to test: H0: β = 0, Ha: β ≠ 0. Use results from the null distribution of simulated slopes shown to determine the standardized statistic.
(Short Answer)
4.7/5  (40)
(40)
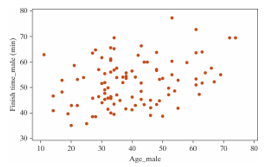
The following scatterplot displays the finish time (in minutes) and age (in years) for the male racers at the 2018 Strawberry Stampede (a 10k race through Arroyo Grande).
 Below are the same data for the female racers in this year's race.
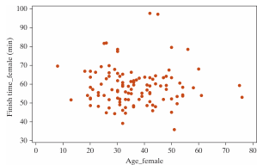 -Select the best explanation for how one sample would be simulated in order to generate the null distribution for the females.
(Multiple Choice)
4.9/5 (37)
Annual measurements of the number of powerboat registrations (in thousands) and the number of manatees killed by powerboats in Florida were collected over the 14 years 1977-1990. A scatterplot of the data, least squares regression line, and correlation coefficient follow. 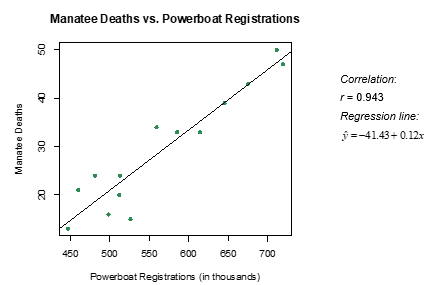 -Fill in the blanks with the appropriate values to interpret the y-intercept:
We predict ___(1)____ manatee deaths when there are ____(2)____ powerboat registrations.
-Fill in the blanks with the appropriate values to interpret the y-intercept:
We predict ___(1)____ manatee deaths when there are ____(2)____ powerboat registrations.
(Short Answer)
4.8/5 (27)
The least squares regression line minimizes the absolute value of the residuals.
(True/False)
4.9/5 (35)
Data from gapminder.org on 184 countries was used to examine if there is an association between (average) female life expectancy (that is, the average lifespan of women in the country) and the average number of children women give birth to for the year 2019. A scatterplot of the data and a regression table from the Corr/Regression applet follows. 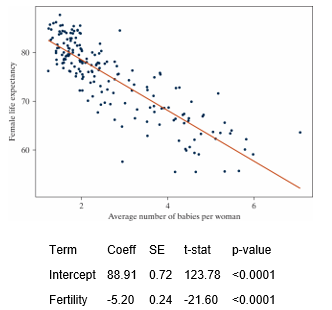 -Which of the following validity conditions does not need to be checked in order to conduct a theory-based test for a regression slope?
(Multiple Choice)
4.9/5 (39)
It is commonly expected that as a person ages, their muscle mass decreases. To further examine this relationship in women, a nutritionist randomly selected 60 female patients from her clinic, 15 women from each 10-year age group beginning with age 40 and ending with age 80. For each patient, her age and current muscle mass was recorded. A scatterplot, least squares regression line, and coefficient of determination are as follows. 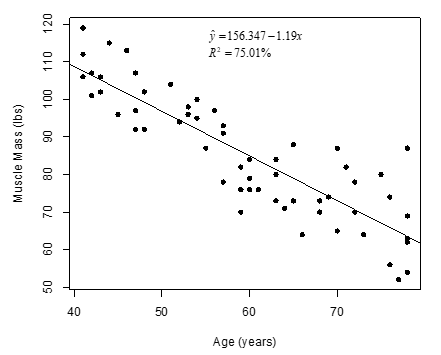 -If you were to conduct a simulation-based test using the correlation coefficient as your statistic, would the p-value be larger, smaller, or remain the same as the p-value reported in question 58?
(Multiple Choice)
4.9/5 (36)
Babies born with low birth weights (less than 2500 grams) are at an increased risk for many infant diseases. Researchers in North Carolina collected data to see what variables may influence the birth weight (in grams) of a child, including whether the mother drank alcohol during pregnancy, whether the mother smoked during pregnancy, the mother's age (years), the gestation of the pregnancy (number of weeks from conception until birth), the mother's race, the length of the birth (hours), and several others. The plot below summarizes some of the variables measured. 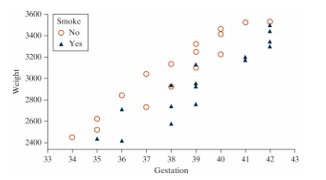 -Does the association between gestation period and birthweight appear to depend on smoking status?
(Multiple Choice)
4.9/5 (31)
Annual measurements of the number of powerboat registrations (in thousands) and the number of manatees killed by powerboats in Florida were collected over the 14 years 1977-1990. A scatterplot of the data, least squares regression line, and correlation coefficient follow.
-The year 1984 had 559,000 powerboat registrations and 34 manatee deaths. Did the least squares regression line underestimate, overestimate, or accurately estimate the number of manatee deaths for the year 1984?
(Multiple Choice)
4.9/5 (36)
How is the number of pages in a textbook related to the price of the textbook? To find out, two Cal Poly freshmen (2006) randomly selected 30 textbooks at the campus bookstore and recorded the price ($) and number of pages for each book. Here's output from analyzing the data collected in the Corr/Regression applet. Assume, for now, that the normal approximation-based method is valid, and thus, the p-value from the Regression Table below is valid. 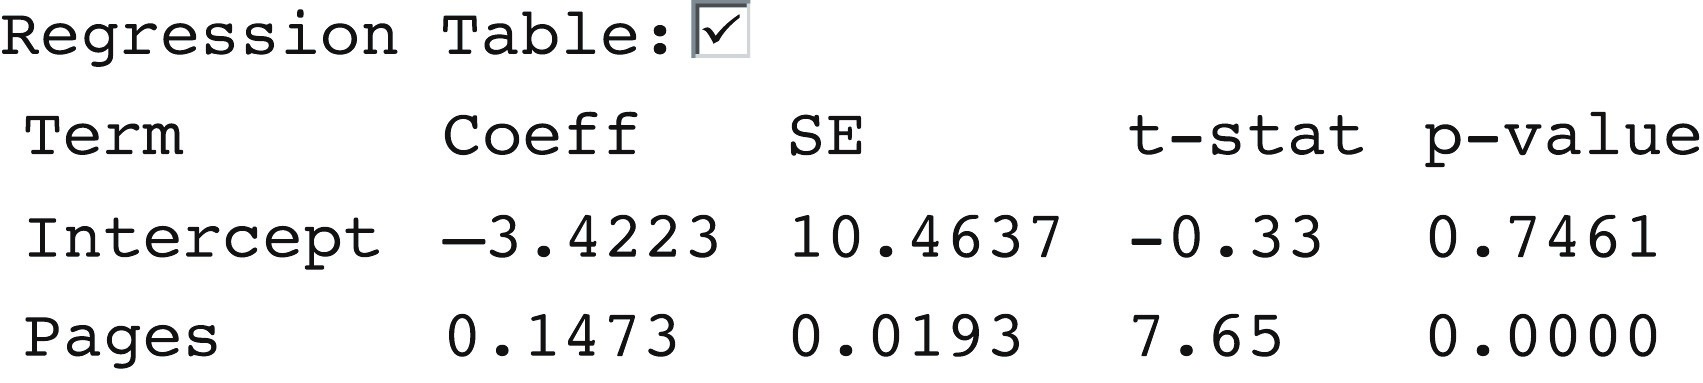 -A 95% confidence interval for the population slope is (0.108, 0.187). Which of the following statements are valid based on this interval?
(Multiple Choice)
4.9/5 (30)
Are people with bigger brains more intelligent? Forty college students volunteered to participate in a study which examined brain size (measured as 1000's of pixels counted in a brain scan), and IQ scores (measured in points). A scatterplot of the data is shown below. 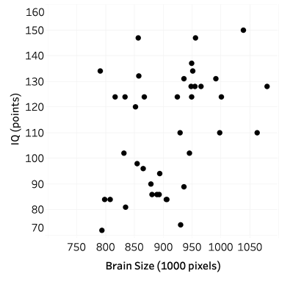 -Approximate the value of the correlation coefficient for these data.
(Multiple Choice)
4.9/5 (36)
Annual measurements of the number of powerboat registrations (in thousands) and the number of manatees killed by powerboats in Florida were collected over the 14 years 1977-1990. A scatterplot of the data, least squares regression line, and correlation coefficient follow.
-How would you interpret the slope of the regression line in the context of the problem? Select all that apply.
(Multiple Choice)
4.9/5 (37)
It is commonly expected that as a person ages, their muscle mass decreases. To further examine this relationship in women, a nutritionist randomly selected 60 female patients from her clinic, 15 women from each 10-year age group beginning with age 40 and ending with age 80. For each patient, her age and current muscle mass was recorded. A scatterplot, least squares regression line, and coefficient of determination are as follows.
-Which of the following is a correct interpretation of the coefficient of determination?
(Multiple Choice)
4.7/5 (41)
Data from the World Bank for 25 Western Hemisphere countries was used to examine the association between (average) female life expectancy (that is, the average lifespan of women in the country) and the average number of children women give birth to. Given below is the scatterplot for the data. 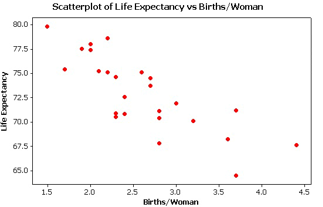 The regression equation for this context is found to be:
y= 84.5 - 4.4x
where Y is female life expectancy in years, and is the average number of births per woman.
-Interpret the y-intercept in the context of the study.
The regression equation for this context is found to be:
y= 84.5 - 4.4x
where Y is female life expectancy in years, and is the average number of births per woman.
-Interpret the y-intercept in the context of the study.
(Multiple Choice)
4.8/5 (33)
Data from the World Bank for 25 Western Hemisphere countries was used to examine the association between (average) female life expectancy (that is, the average lifespan of women in the country) and the average number of children women give birth to. Given below is the scatterplot for the data. The regression equation for this context is found to be:
y= 84.5 - 4.4x
where Y is female life expectancy in years, and is the average number of births per woman.
-Is the interpretation of the y-intercept meaningful in the context? Why?
(Multiple Choice)
4.7/5 (36)
Data from gapminder.org on 184 countries was used to examine if there is an association between (average) female life expectancy (that is, the average lifespan of women in the country) and the average number of children women give birth to for the year 2019. A scatterplot of the data and a regression table from the Corr/Regression applet follows.
-State the null and alternative hypotheses to examine if there is an association between female life expectancy and the average number of children women give birth to for the year 2019.
(Multiple Choice)
5.0/5 (34)
The following scatterplot displays the finish time (in minutes) and age (in years) for the male racers at the 2018 Strawberry Stampede (a 10k race through Arroyo Grande). 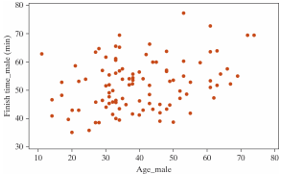 -What is the direction of the association between finish time and age?
(Multiple Choice)
4.8/5 (25)
Data from gapminder.org on 184 countries was used to examine if there is an association between (average) female life expectancy (that is, the average lifespan of women in the country) and the average number of children women give birth to for the year 2019. A scatterplot of the data follows. 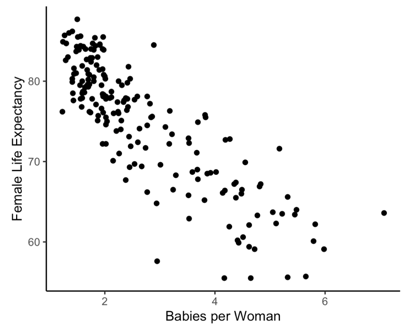 -Approximate the correlation coefficient for these data.
(Multiple Choice)
4.9/5 (32)
A student in an AP Statistics class decided to conduct a study to determine whether you could predict the number of followers a teen has on Instagram based on the number of people he or she is following. To do this, she randomly selected fifty students from her high school that had Instagram accounts and for each student recorded the number of people they were following and the number of followers they had. A scatterplot of the data is shown.
The regression line is
.
followers=-45.3+1.21(following)
-Based on the standardized statistic, is there strong evidence of an association between the number of followers and the number of people following an Instagram account?
(Multiple Choice)
4.9/5 (37)
Data from gapminder.org on 184 countries was used to examine if there is an association between (average) female life expectancy (that is, the average lifespan of women in the country) and the average number of children women give birth to for the year 2019. A scatterplot of the data follows.
-Below is a picture of a simulated null distribution of correlation coefficients created using the Corr/Regression applet. How would you use this distribution to calculate the p-value? 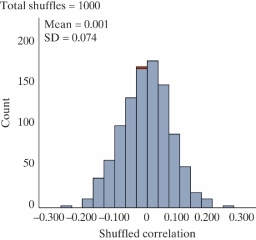
(Multiple Choice)
4.8/5 (42)
It is commonly expected that as a person ages, their muscle mass decreases. To further examine this relationship in women, a nutritionist randomly selected 60 female patients from her clinic, 15 women from each 10-year age group beginning with age 40 and ending with age 80. For each patient, her age and current muscle mass was recorded. A scatterplot, least squares regression line, and coefficient of determination are as follows.
-Write a sentence interpreting the value of the slope in the context of the study.
(Multiple Choice)
4.7/5 (36)
Filters
- Essay(0)
- Multiple Choice(0)
- Short Answer(0)
- True False(0)
- Matching(0)