Exam 4: Systems of Linear Equations and Inequalities
Exam 1: The Real Number System166 Questions
Exam 2: Linear Equations and Inequalities in One Variable477 Questions
Exam 3: Linear Equations and Inequalities in Two Variables; Functions384 Questions
Exam 4: Systems of Linear Equations and Inequalities342 Questions
Exam 5: Exponents and Polynomials186 Questions
Exam 6: Factoring and Applications425 Questions
Exam 7: Rational Expressions and Applications248 Questions
Exam 8: Roots and Radicals288 Questions
Exam 9: Quadratic Equations355 Questions
Exam 10: Preparing for Your Math Final178 Questions
Select questions type
Solve the problem.
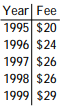
-This chart shows the fees for an 18- hole round of golf for each of the last 5 years at a local municipal golf course. Write the information in the chart as a set of ordered pairs.
(Multiple Choice)
4.9/5  (32)
(32)
Solve the problem.
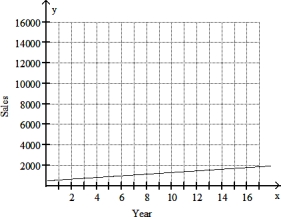
-Suppose that sales of a particular brand of appliance satisfy the relationship y = 80x + 500, where y represents the number of sales in year x, with x = 0 corresponding to 1992. What does the ordered pair (13, 1540) mean in the context of the situation?
(Multiple Choice)
4.8/5 (34)
Tell whether or not the relation is a function.
-{(1, - 7), (1, 6), (6, 1), (7, - 9), (12, - 4)}
(True/False)
5.0/5 (38)
Decide whether or not the ordered pair is a solution to the equation
-3x + y = 14; (4, 2)
(True/False)
4.8/5 (34)
Decide whether or not the ordered pair is a solution to the equation
-x + 7 = 0; (- 7, 5)
(True/False)
4.9/5 (38)
Graph the line through the given point with the given slope.
-(1, - 2), undefined slope
(Multiple Choice)
4.9/5 (40)
Write the slope-intercept form of the equation for the line passing through the given pair of points.
-(- 3, 1) and (7, - 8)
(Multiple Choice)
4.9/5 (36)
Solve the problem.
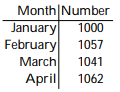
-This chart shows the number of meals served in a restaurant during each of the past 4 months. Assume that the information in the chart defines a function with the name g. Find g(March).
(Multiple Choice)
4.8/5 (37)
Complete the graph by shading the correct region.
-y x - 6
(Multiple Choice)
4.9/5 (44)
Complete the graph by shading the correct region.
-x + y 4
(Multiple Choice)
4.9/5 (34)
Solve by graphing. Label the axes and show where the solution is located on the graph.
-Suppose y = mx + b is a mathematical model for actual time as a function of estimated time, where y represents actual time and x represents estimated time and m and b are constants. If m = 3.6 and b = - 1, find y when x is 15 min.
(Multiple Choice)
4.9/5 (37)
Determine whether the graphs of the equations are parallel lines, perpendicular lines, or neither.
-3x - 8y = - 5
32x + 12y = - 5
(Multiple Choice)
4.7/5 (33)
Graph the linear equation. Give the x- and y- intercepts.
-y = - 3
(Multiple Choice)
4.8/5 (38)
Graph the line through the given point with the given slope.
-(- 6, - 8) , m =2/3 
(Multiple Choice)
4.7/5 (43)
Find the slope of the line.
-A line parallel to the graph of y - 4 = 6
(Multiple Choice)
4.8/5 (39)
Complete the graph by shading the correct region.
-y + 4 < x
(Multiple Choice)
4.8/5 (41)
Describe the graph of the function f(x) = x + 3 if the domain is( 2, 3, 4, 5 ).
(Multiple Choice)
4.9/5 (49)
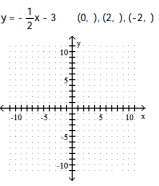
Complete the ordered pairs. Then graph the equation by plotting the points and drawing a line through them
-? 
(Multiple Choice)
4.7/5 (40)
Filters
- Essay(0)
- Multiple Choice(0)
- Short Answer(0)
- True False(0)
- Matching(0)