Exam 4: Systems of Linear Equations and Inequalities
Exam 1: The Real Number System166 Questions
Exam 2: Linear Equations and Inequalities in One Variable477 Questions
Exam 3: Linear Equations and Inequalities in Two Variables; Functions384 Questions
Exam 4: Systems of Linear Equations and Inequalities342 Questions
Exam 5: Exponents and Polynomials186 Questions
Exam 6: Factoring and Applications425 Questions
Exam 7: Rational Expressions and Applications248 Questions
Exam 8: Roots and Radicals288 Questions
Exam 9: Quadratic Equations355 Questions
Exam 10: Preparing for Your Math Final178 Questions
Select questions type
Provide an appropriate response.
-What were the total sales for the first 6 months of 2007?
(Multiple Choice)
4.8/5  (31)
(31)
Choose the line that most closely resembles the graph of the given equation.
-y = 3x + 4
(Multiple Choice)
4.8/5 (35)
Evaluate the function.
-Given f(x) = 5x 2 + 5x - 5, find f( - 6).
(Multiple Choice)
4.7/5 (38)
Solve the problem.
-Data regarding the amount spent by a government department is represented in the following graph. Find the slope of the line by using any two of the points shown on the line. Is the slope equal to the yearly change in amount spent?

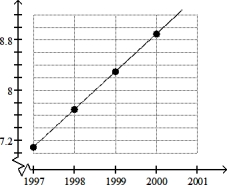 Year
Year
(Multiple Choice)
4.7/5 (30)
Graph the line through the given point with the given slope.
-(- 2, - 3), m = 3
(Multiple Choice)
4.7/5 (37)
Find the intercepts for the graph of the equation.
-- 3x + y = 3
(Multiple Choice)
5.0/5 (38)
Solve the problem.
-Suppose that during a certain step in a chemical manufacturing process the amount of chlorine dissolved in a solution, measured in parts per million (ppm), is related to the elapsed time measured from the beginning of the step. Use the following table as a representation of this relationship. What does the ordered pair (9, 26.4) mean in the context of this situation? 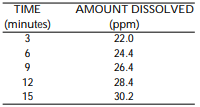
(Multiple Choice)
4.8/5 (43)
Solve the problem.
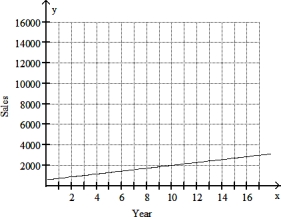
-The graph shows the sales of a particular brand of appliance from 1992 to 2010, where 1992 corresponds to x = 0. Two of the data points in the graph can be represented by the ordered pairs (0, 600) and (10, 2000). Use these ordered pairs to write an equation of a line that models the data. Give the equation in slope- intercept form.
(Multiple Choice)
4.8/5 (43)
Decide whether the equation defines y as a function of x. (Remember that to be a function, every value of x must give one and only one value of y.)
-y = - 7x - 9
(True/False)
4.7/5 (47)
State whether the graph is or is not that of a function.
-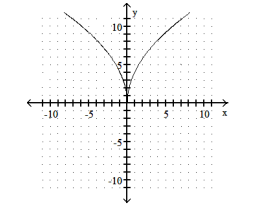
(Multiple Choice)
4.8/5 (43)
Solve the problem.
-This chart shows the number of meals served in a restaurant during each of the past 4 months. Assume that the information in the chart defines a function with the name g. State the range of g.
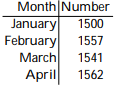
(Multiple Choice)
4.8/5 (41)
Use the geometric interpretation of slope (rise divided by run) to find the slope of the line. Then, by identifying the y- intercept from the graph, write the slope- intercept form of the equation of the line.
-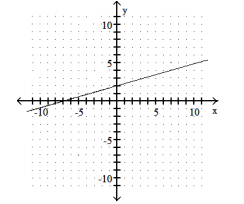
(Multiple Choice)
4.7/5 (39)
The table shown was generated by a graphics calculator. The expression y1 represents f(x).
-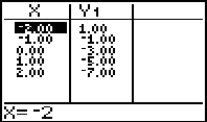 If f(x) = -7, then x = ?
(Multiple Choice)
4.9/5 (41)
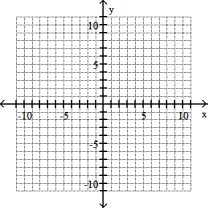
Plot the ordered pairs on the rectangular coordinate system provided.
-A(6, 4), B(- 3, 6) 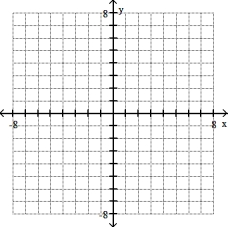
(Multiple Choice)
4.9/5 (32)
Find an equation in slope-intercept form of the line satisfying the specified conditions.
-Through (6, 7), parallel to - 7x + 3y = - 39
(Multiple Choice)
4.9/5 (47)
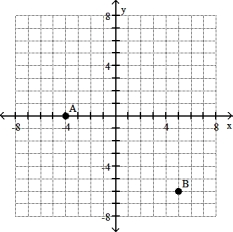
Give the ordered pairs for the points labeled on the graph.
-
(Multiple Choice)
4.7/5 (30)
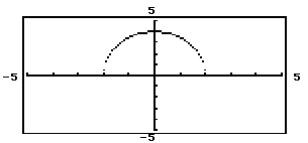
State whether the graph is or is not that of a function.
-
(Multiple Choice)
4.8/5 (37)
Filters
- Essay(0)
- Multiple Choice(0)
- Short Answer(0)
- True False(0)
- Matching(0)