Exam 4: Systems of Linear Equations and Inequalities
Exam 1: The Real Number System166 Questions
Exam 2: Linear Equations and Inequalities in One Variable477 Questions
Exam 3: Linear Equations and Inequalities in Two Variables; Functions384 Questions
Exam 4: Systems of Linear Equations and Inequalities342 Questions
Exam 5: Exponents and Polynomials186 Questions
Exam 6: Factoring and Applications425 Questions
Exam 7: Rational Expressions and Applications248 Questions
Exam 8: Roots and Radicals288 Questions
Exam 9: Quadratic Equations355 Questions
Exam 10: Preparing for Your Math Final178 Questions
Select questions type
Write the slope-intercept form of the equation for the line passing through the given pair of points.
-(6, - 6) and (0, 5)
(Multiple Choice)
4.9/5  (49)
(49)
Write an equation for the line passing through the given pair of points. Give your final answer in standard form.
-(- 6, - 5) and (- 15, 3)
(Multiple Choice)
4.8/5 (33)
Find the slope of the line going through the given pair of points.
-(2, 2) and (5, 2)
(Multiple Choice)
4.9/5 (41)
Give the ordered pairs for the points labeled on the graph.
-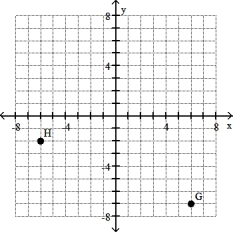
(Multiple Choice)
4.8/5 (35)
Solve the problem.
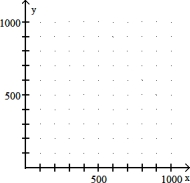
-A hardware store has room for 1000 bags of fertilizer. The fertilizer manufacturer plans to ship x bags of fertilizer with a weed killer and y bags of fertilizer without the weed killer. This can be represented by x + y c 1000. Graph this inequality in quadrant I.
(Multiple Choice)
4.9/5 (33)
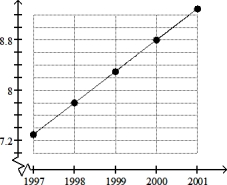
Solve the problem.
-Data regarding the amount spent by a government department is represented in the following graph. Find the change in amount spent for the years shown in the graph. Is the graph a straight line?

 Year
Year
(Multiple Choice)
4.8/5 (35)
Provide an appropriate response.
-What were the total sales for the first 6 months of 2006?
(Multiple Choice)
4.8/5 (30)
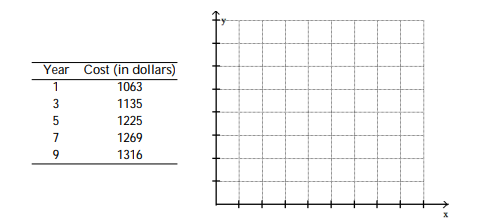
Solve the problem.
-The table lists the average annual cost (in dollars) of tuition and fees at a certain 2- year college for selected years, where year 1 represents 1992, year 3 represents 1994, and so on. Write the ordered pairs representing these data and plot the points.
(Multiple Choice)
4.8/5 (39)
Find an equation in slope-intercept form of the line satisfying the specified conditions.
-Through (- 5, 0), parallel to - 3x + 2y = 13
(Multiple Choice)
4.9/5 (28)
Decide whether the equation defines y as a function of x. (Remember that to be a function, every value of x must give one and only one value of y.)
-x = y2 + 7
(True/False)
4.8/5 (30)
Graph the line through the given point with the given slope.
-(3, -1), m = 0
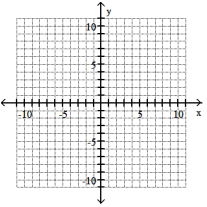
(Multiple Choice)
4.8/5 (41)
The table shown was generated by a graphics calculator. The expression y1 represents f(x).
-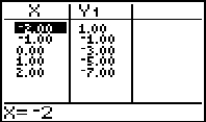 Write the function in the form y = mx + b.
(Multiple Choice)
5.0/5 (32)
The equation y = x2 is satisfied by the points (2, 4) and (- 2, 4). A horizontal line may be drawn between these two points. Is y = x2 a function? Why or why not?
(Essay)
4.8/5 (32)
Graph the line through the given point with the given slope.
-(- 4, - 3), m 1/2
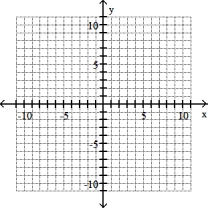
(Multiple Choice)
5.0/5 (41)
Use the coordinates of the indicated points to find the slope of the line.
-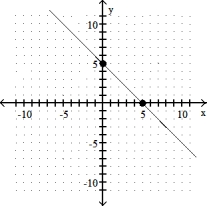
(Multiple Choice)
4.7/5 (41)
Filters
- Essay(0)
- Multiple Choice(0)
- Short Answer(0)
- True False(0)
- Matching(0)