Exam 4: Systems of Linear Equations and Inequalities
Exam 1: The Real Number System166 Questions
Exam 2: Linear Equations and Inequalities in One Variable477 Questions
Exam 3: Linear Equations and Inequalities in Two Variables; Functions384 Questions
Exam 4: Systems of Linear Equations and Inequalities342 Questions
Exam 5: Exponents and Polynomials186 Questions
Exam 6: Factoring and Applications425 Questions
Exam 7: Rational Expressions and Applications248 Questions
Exam 8: Roots and Radicals288 Questions
Exam 9: Quadratic Equations355 Questions
Exam 10: Preparing for Your Math Final178 Questions
Select questions type
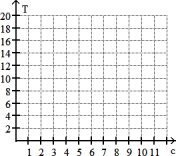
Solve by graphing. Label the axes and show where the solution is located on the graph.
-The cost, T, in hundreds of dollars, of tuition at one community college is given by T = 3 + 1.25c, where c is the number of credits for which a student registers. Graph the equation and use the graph to estimate the cost of tuition if a student registers for 10 credits.
(Multiple Choice)
4.8/5  (32)
(32)
Provide the proper response.
-If two nonvertical lines never intersect, what do we know about their slopes?
(Short Answer)
4.9/5 (30)
The table shown was generated by a graphics calculator. The expression y1 represents f(x).
-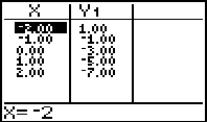 All the points lie on a straight line. What is the slope of the line?
(Multiple Choice)
4.9/5 (34)
Answer the question or write an explanation.
-What is the minimum number of quadrants totally or partially shaded in the graph of y > mx + b, when m > 0, b >
0? Which quadrants are they?
(Short Answer)
4.8/5 (27)
Decide whether the relation represents a function. If it does, give the domain and the range.
-{(- 1, 6), (3, - 8), (3, 4)}
(Multiple Choice)
4.8/5 (36)
Provide the proper response.
-What is wrong with the statement "The line has no slope."?
(Essay)
4.8/5 (38)
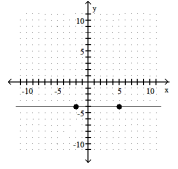
Use the coordinates of the indicated points to find the slope of the line.
-
(Multiple Choice)
4.9/5 (32)
Graph the equation by using the slope and y- intercept.
-2x - 3y = 6
(Multiple Choice)
4.8/5 (35)
Answer the question.
-In quadrant II, the y- coordinate of a point is always negative.
(True/False)
4.9/5 (36)
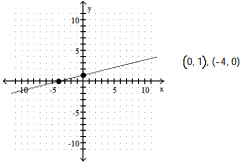
Use the geometric interpretation of slope (rise divided by run) to find the slope of the line. Then, by identifying the y- intercept from the graph, write the slope- intercept form of the equation of the line.
-
(Multiple Choice)
4.8/5 (28)
Use the coordinates of the indicated points to find the slope of the line.
-
(Multiple Choice)
4.8/5 (31)
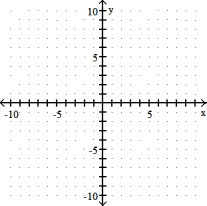
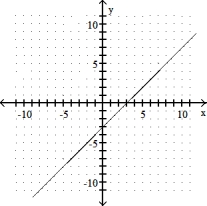
Choose the line that most closely resembles the graph of the given equation.
-y = -3x - 4
(Multiple Choice)
4.9/5 (32)
Evaluate the function.
-Given f(x) = x2 - 5x + 5, find f(3).
(Multiple Choice)
4.9/5 (26)
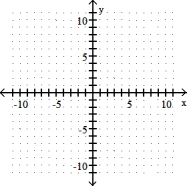
Complete the ordered pairs. Then graph the equation by plotting the points and drawing a line through them
-y = 2x + 6 (0, ), ( , 0), (2, )

(Multiple Choice)
4.7/5 (35)
Decide whether the equation defines y as a function of x. (Remember that to be a function, every value of x must give one and only one value of y.)
-y = 2
(True/False)
4.8/5 (29)
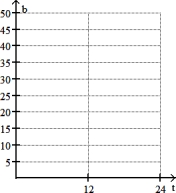
Solve by graphing. Label the axes and show where the solution is located on the graph.
-In one U.S. town the annual consumption, b, of beef (in kg per person) can be estimated by b = - .33t + 25, where t is the number of years since 1975. Graph the equation and use the graph to estimate the beef consumption in the year 1995.
(Multiple Choice)
4.7/5 (26)
Complete the ordered pairs. Then graph the equation by plotting the points and drawing a line through them
-y + 6 = x (0, ), ( , 0), (5, )
(Multiple Choice)
4.8/5 (31)
Filters
- Essay(0)
- Multiple Choice(0)
- Short Answer(0)
- True False(0)
- Matching(0)