Exam 5: Data, Graphs, and Statistics
Exam 1: Whole Numbers394 Questions
Exam 2: Fraction Notation352 Questions
Exam 3: Decimal Notation457 Questions
Exam 4: Percent Notation436 Questions
Exam 5: Data, Graphs, and Statistics157 Questions
Exam 6: Geometry317 Questions
Exam 7: Introduction to Real Numbers and Algebraic Expressions354 Questions
Exam 8: Solving Equations and Inequalities272 Questions
Exam 9: Graphs of Linear Equations190 Questions
Exam 10: Polynomials: Operations389 Questions
Exam 11: Polynomials: Factoring192 Questions
Exam 12: Rational Expressions and Equations199 Questions
Exam 13: Systems of Equations79 Questions
Exam 14: Radical Expressions and Equations149 Questions
Exam 15: Quadratic Equations185 Questions
Exam 16: Converting Units of Measurement459 Questions
Select questions type
For the set of numbers, find the mean, median, and any mode that exist.
-
(Multiple Choice)
4.7/5  (40)
(40)
Use the circle graph to solve the problem.
-There are 6000 students attending the local university. The circle graph shows the percentage of those students who attend different sporting events.
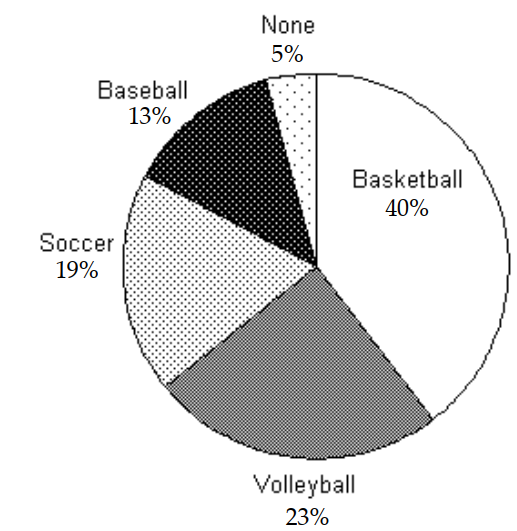 How many students attend Basketball and Baseball games?
(Multiple Choice)
4.9/5 (33)
Use the pictograph to answer the question.
-For selected countries, this pictograph shows approximately how many kilograms of seafood are consumed by each person (per capita) annually.
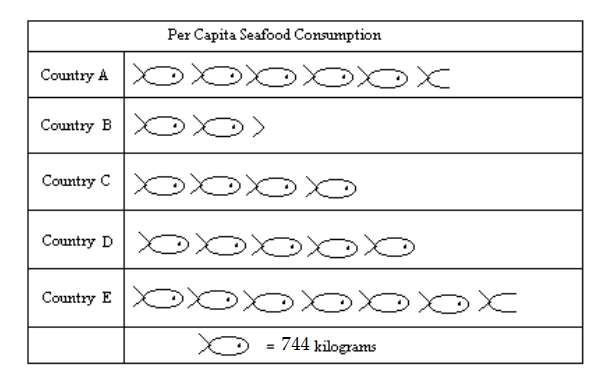 People in Country D eat approximately what percent more seafood than people in Country C?
(Multiple Choice)
4.9/5 (25)
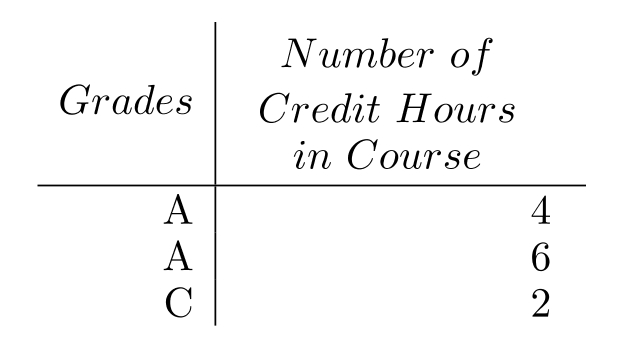
Given the grades of a student for one semester, find the grade point average. Assume that the grade point values are 4.0 for an for a , and so on. Round to the nearest tenth.
-
(Multiple Choice)
4.8/5 (29)
The bar graph below shows the number of students by major in the College of Arts and Sciences. Answer the question.
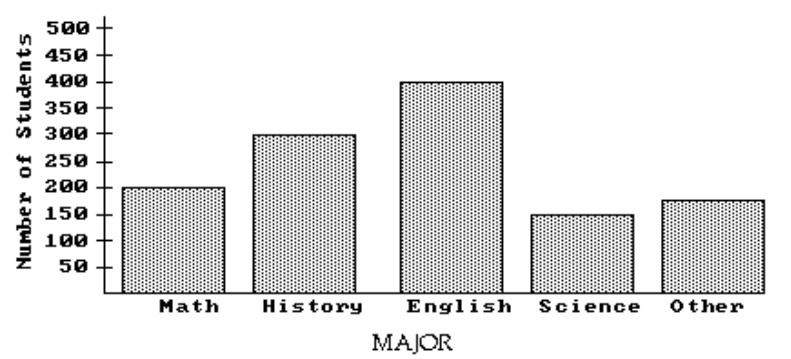 -The science department is planning to buy some new equipment. They want to make sure that there is one of the new machines for every 5 students majoring in science. If each machine costs 450 , how much should they budget for the new equipment?
(Multiple Choice)
4.8/5 (29)
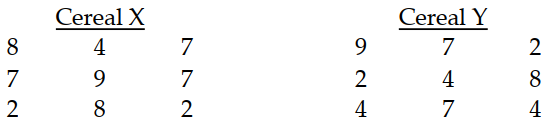
Solve the problem.
-An experiment is done to determine which of two cereals tastes better. Shoppers test each kind of cereal and give it a rating from 1 to 10 . The results are in the two tables below. Which type of cereal is better?
(Multiple Choice)
4.8/5 (35)
Determine the quartiles as specified.
-The test scores of 15 students are listed below. Find the first quartile.

(Multiple Choice)
4.7/5 (36)
A deck of cards contains 52 cards. These cards consist of four suits - hearts, spades, clubs, and diamonds. Each suit contains one of each of the following: , jack, queen, king, and ace. Assume that one card is selected at random from a well-shuffled deck of cards.
-Find the probability that the card is a red card.
(Multiple Choice)
4.9/5 (35)
A deck of cards contains 52 cards. These cards consist of four suits - hearts, spades, clubs, and diamonds. Each suit contains one of each of the following: , jack, queen, king, and ace. Assume that one card is selected at random from a well-shuffled deck of cards.
-Find the probability that the card is a hearts picture card (the jack, queen, or king of hearts).
(Multiple Choice)
4.8/5 (36)
Construct the indicated stem-and-leaf.
-The following data show the number of laps run by each participant in a marathon. 
(Multiple Choice)
4.8/5 (36)
Use the pictograph to answer the question.
-This pictograph shows projected sales of compact disks (CDs) for a popular rock band for seven consecutive years.
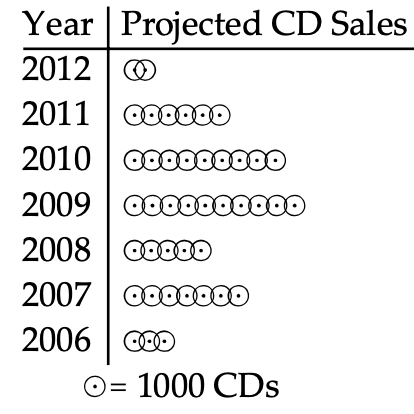 Approximately how many CDs will be sold in 2011?
(Multiple Choice)
4.9/5 (35)
Refer to the double-bar graph below which shows the number of male and female athletes at a university over a four-year period. Solve the problem.
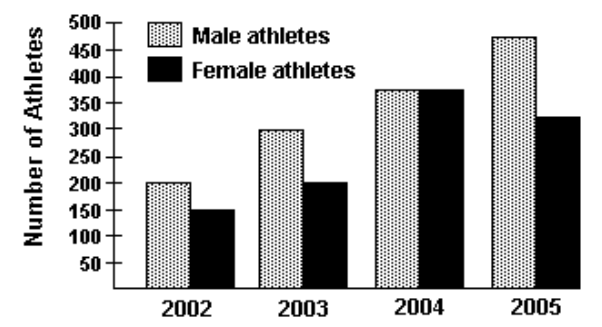 -Find the increase in the number of male athletes from 2002 to 2004.
(Multiple Choice)
4.8/5 (35)
Determine the quartiles as specified.
-The test scores of 19 students are listed below. Find the third quartile.

(Multiple Choice)
4.8/5 (37)
The histogram shows the scores of each participant in a game from a total of 100 participants.
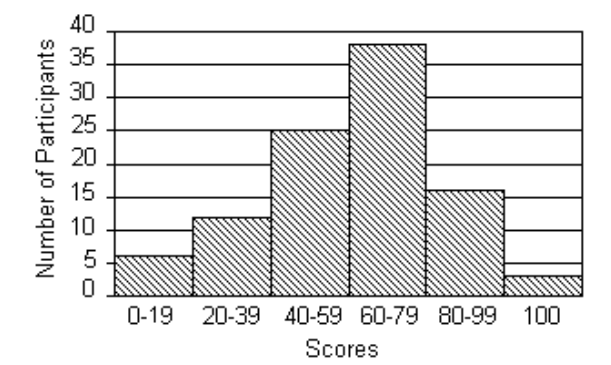 -The greatest number of participants is within which category?
(Multiple Choice)
4.8/5 (33)
Filters
- Essay(0)
- Multiple Choice(0)
- Short Answer(0)
- True False(0)
- Matching(0)