Exam 5: Data, Graphs, and Statistics
Exam 1: Whole Numbers394 Questions
Exam 2: Fraction Notation352 Questions
Exam 3: Decimal Notation457 Questions
Exam 4: Percent Notation436 Questions
Exam 5: Data, Graphs, and Statistics157 Questions
Exam 6: Geometry317 Questions
Exam 7: Introduction to Real Numbers and Algebraic Expressions354 Questions
Exam 8: Solving Equations and Inequalities272 Questions
Exam 9: Graphs of Linear Equations190 Questions
Exam 10: Polynomials: Operations389 Questions
Exam 11: Polynomials: Factoring192 Questions
Exam 12: Rational Expressions and Equations199 Questions
Exam 13: Systems of Equations79 Questions
Exam 14: Radical Expressions and Equations149 Questions
Exam 15: Quadratic Equations185 Questions
Exam 16: Converting Units of Measurement459 Questions
Select questions type
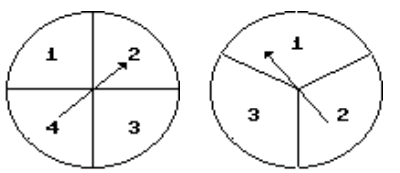
Draw a tree diagram for the experiment. Then use the diagram to find the number of possible outcomes.
-Spin the first spinner once and the second spinner once.
(Multiple Choice)
4.9/5  (33)
(33)
Refer to the double-bar graph below which shows the number of male and female athletes at a university over a four-year period. Solve the problem.
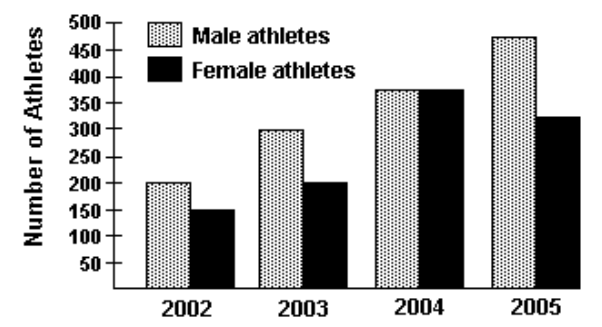 -Find the increase in the number of male athletes from 2004 to 2005.
(Multiple Choice)
4.8/5 (26)
Use the circle graph to solve the problem.
-The circle graph shows the percent of the total population of 19,800 of Springfield living in the given types of housing.
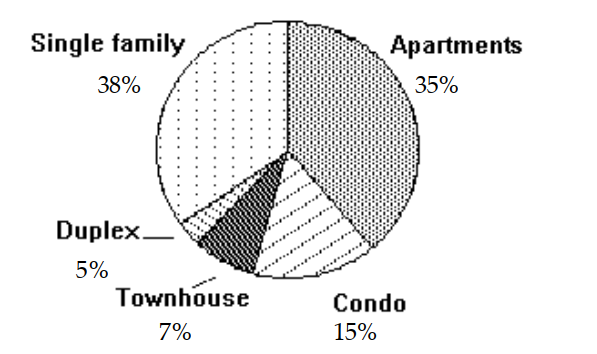 Find the number of people who live in duplexes. Round your result to the nearest whole number.
(Multiple Choice)
4.9/5 (34)
For the set of numbers, find the mean, median, and any mode that exist.
-
(Multiple Choice)
4.8/5 (33)
Use the graph to answer the question.
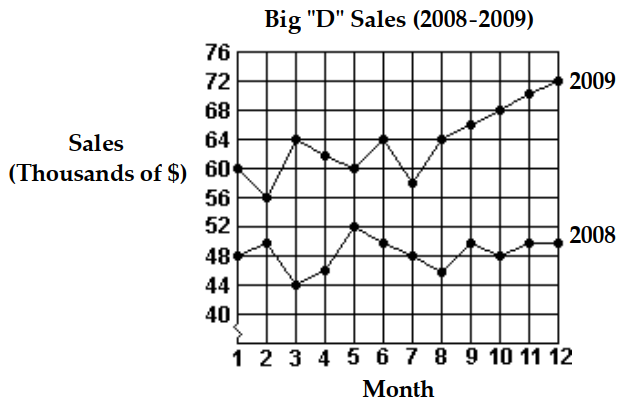 -Which month in 2008 had the lowest sales?
(Multiple Choice)
4.8/5 (28)
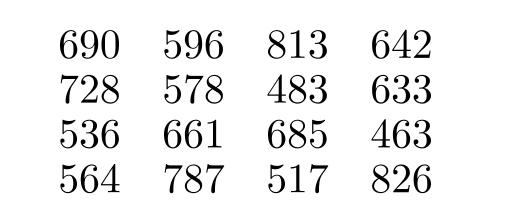
Obtain the five-number summary for the given data.
-The weekly salaries (in dollars) of sixteen government workers are listed below.
(Multiple Choice)
4.9/5 (31)
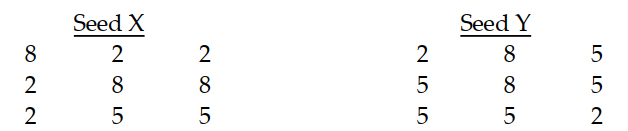
Solve the problem.
-An experiment is done to compare the germination success rates of two types of seeds. Plots containing equal numbers of each kind of seed were planted and the number of seeds that germinated within a set time limit are shown in the tables below. Which type of seed is better?
(Multiple Choice)
4.9/5 (39)
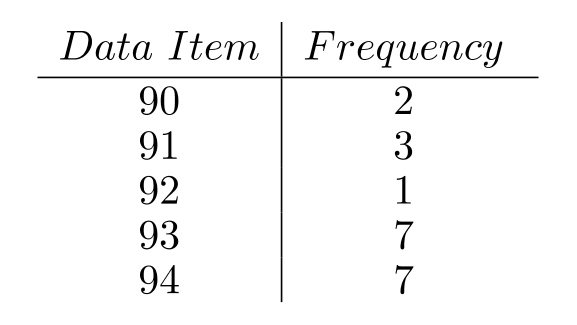
Solve the problem.
-Use the frequency distribution table to find the following:
A. mean (Round to the nearest tenth, if necessary.)
B. median
C.mode
D. range
(Multiple Choice)
4.9/5 (32)
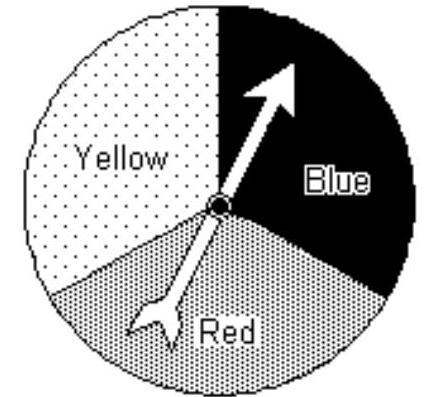
A dart is thrown randomly and sticks on the circular dart board shown. Assume that all sectors are the same size and that the dart does not land on a border between shaded areas.
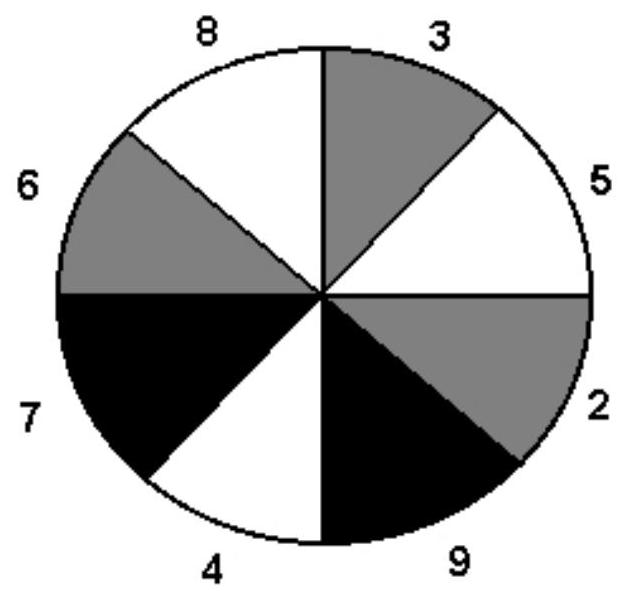 -Find the probability that the dart lands on an area marked with a number greater than 3 and less than or equal to 7.
(Multiple Choice)
4.7/5 (37)
The histogram shows the scores of each participant in a game from a total of 100 participants.
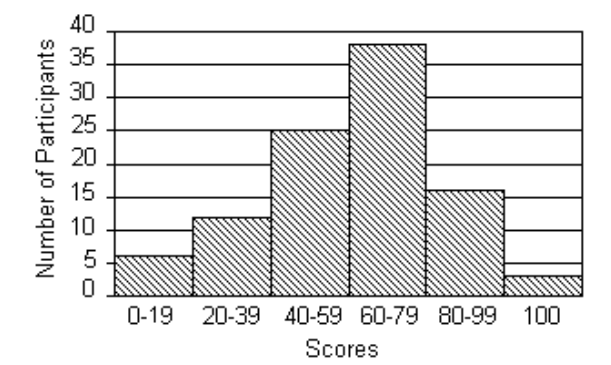 -How many more participants scored 80-99 than 0-19?
(Multiple Choice)
4.8/5 (36)
The following table contains information about moons orbiting a planet named Geo I. Use the table to solve the problem.
-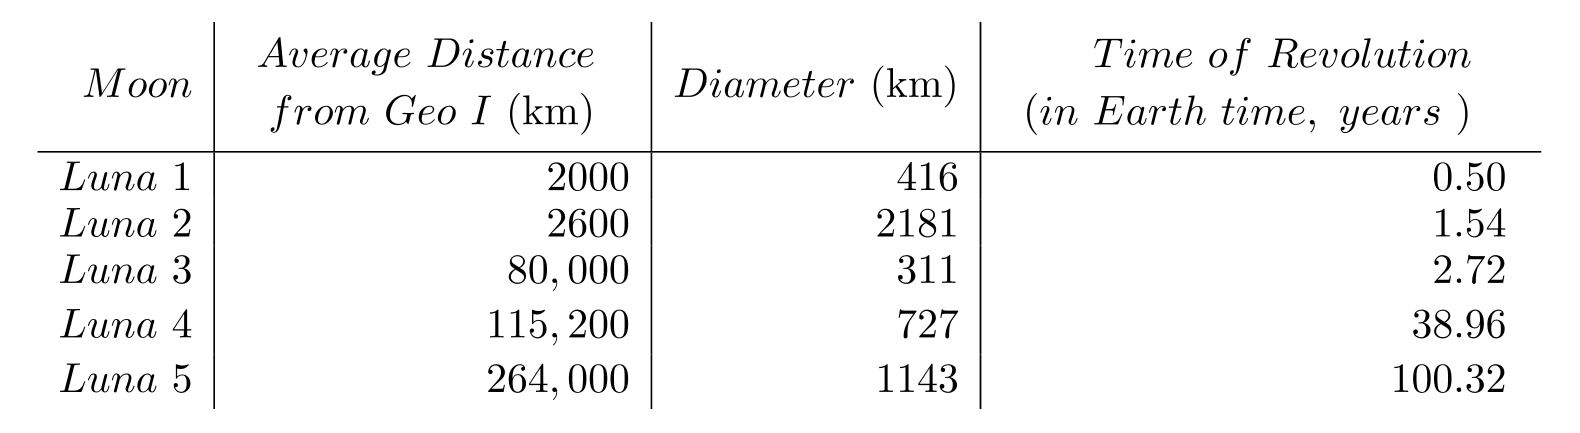 Find the average distance from Geo I to its moon Luna 1.
(Multiple Choice)
4.7/5 (42)
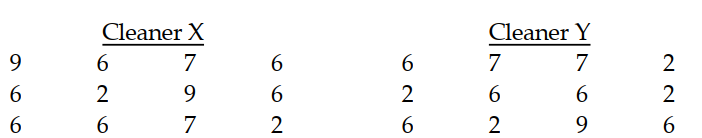
Solve the problem.
-An experiment is done to determine which of two cleaners cleans better. Twelve lab technicians test each kind of cleaner and give it a rating from 1 to 10 . The results are in the two tables below. Which type of cleaner is better?
(Multiple Choice)
4.9/5 (35)
Use the graph to answer the question.
-What was the difference between the highest and lowest monthly sales in 2008?
(Multiple Choice)
4.8/5 (31)
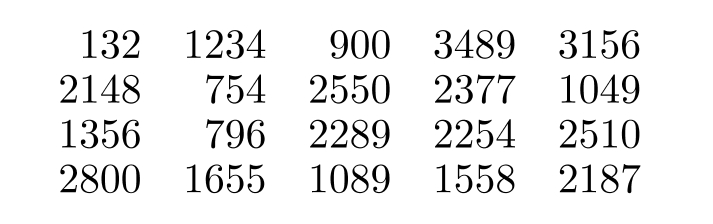
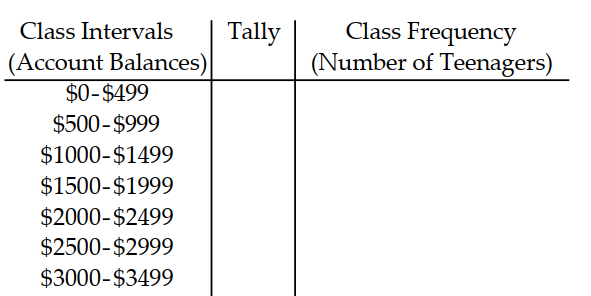
Twenty teenagers were asked to give their current savings account balances. Use the balances shown in the list to complete the frequency distribution table.
-
(Short Answer)
4.8/5 (35)
Solve the problem.
-Jeremy's car got 240 miles (highway) on 8 gallons of gasoline. What was the mean number of miles expected per gallon?
(Multiple Choice)
4.8/5 (22)
A dart is thrown randomly and sticks on the circular dart board shown. Assume that all sectors are the same size and that the dart does not land on a border between shaded areas.
-Find the probability that the dart lands on the sector numbered 2.
(Multiple Choice)
4.8/5 (33)
Solve the problem.
-Draw a tree diagram for the experiment of spinning the spinner once then tossing a coin.
(Multiple Choice)
4.8/5 (30)
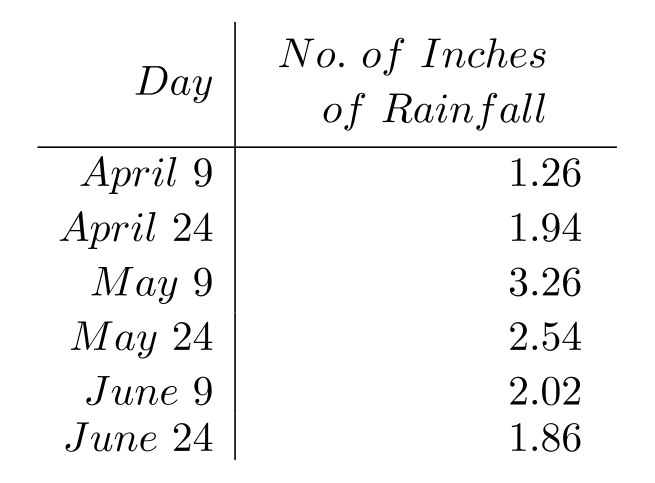
Construct a bar graph to represent the given data.
-The following table shows the number of inches of rainfall measured at City during the following days.
(Essay)
4.8/5 (30)
Filters
- Essay(0)
- Multiple Choice(0)
- Short Answer(0)
- True False(0)
- Matching(0)