Exam 5: Data, Graphs, and Statistics
Exam 1: Whole Numbers394 Questions
Exam 2: Fraction Notation352 Questions
Exam 3: Decimal Notation457 Questions
Exam 4: Percent Notation436 Questions
Exam 5: Data, Graphs, and Statistics157 Questions
Exam 6: Geometry317 Questions
Exam 7: Introduction to Real Numbers and Algebraic Expressions354 Questions
Exam 8: Solving Equations and Inequalities272 Questions
Exam 9: Graphs of Linear Equations190 Questions
Exam 10: Polynomials: Operations389 Questions
Exam 11: Polynomials: Factoring192 Questions
Exam 12: Rational Expressions and Equations199 Questions
Exam 13: Systems of Equations79 Questions
Exam 14: Radical Expressions and Equations149 Questions
Exam 15: Quadratic Equations185 Questions
Exam 16: Converting Units of Measurement459 Questions
Select questions type
The bar graph below shows the number of students by major in the College of Arts and Sciences. Answer the question.
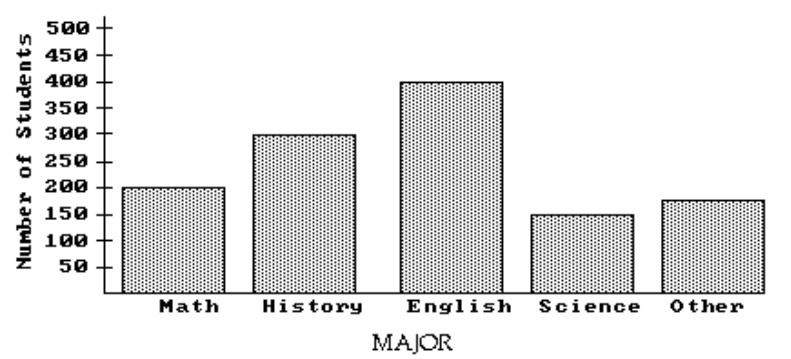 -How many more students are majoring in math than in science?
(Multiple Choice)
4.9/5  (40)
(40)
Use the pictograph to answer the question.
-This pictograph shows projected sales of compact disks (CDs) for a popular rock band for seven consecutive years.
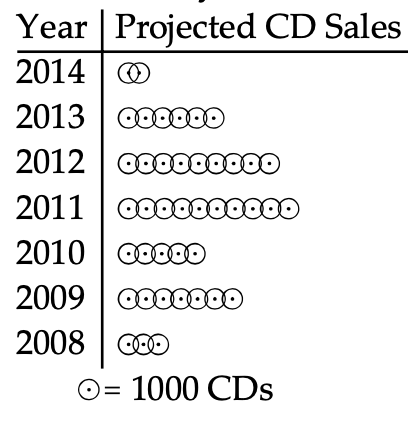 How many sales do symbols represent?
(Multiple Choice)
4.7/5 (33)
Use the circle graph to solve the problem.
-A survey of the 8354 vehicles on the campus of State University yielded the following circle graph.
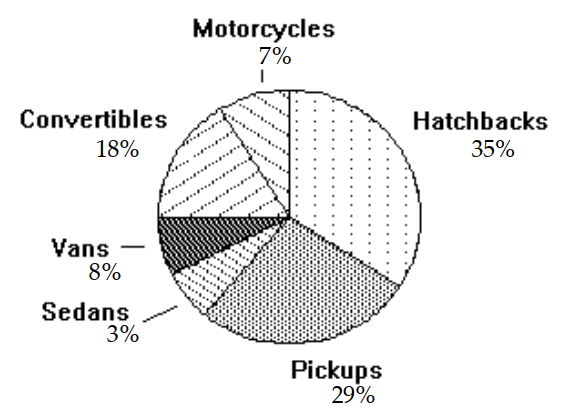 What percent of the vehicles are hatchbacks?
(Multiple Choice)
4.9/5 (37)
Use the circle graph to solve the problem.
-There are 18,000 students attending the local university. The circle graph shows the percentage of those students who attend different sporting events.
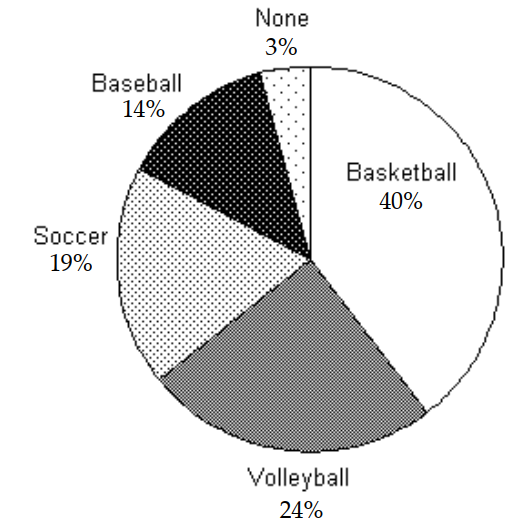 What percentage of students do not attend Soccer or Volleyball matches?
(Multiple Choice)
4.8/5 (34)
Refer to the double-bar graph below which shows the number of male and female athletes at a university over a four-year period. Solve the problem.
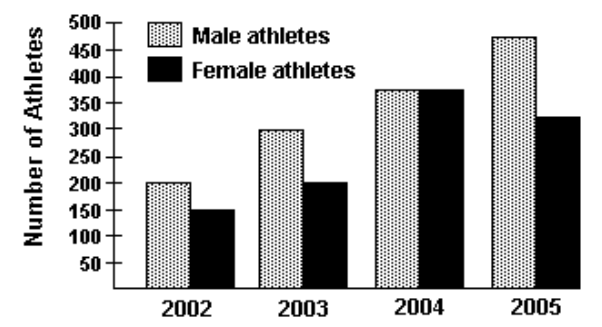 -Which year had the same number of male and female athletes?
(Multiple Choice)
4.9/5 (36)
Use the pictograph to answer the question.
-This pictograph shows projected sales of compact disks (CDs) for a popular rock band for seven consecutive years.
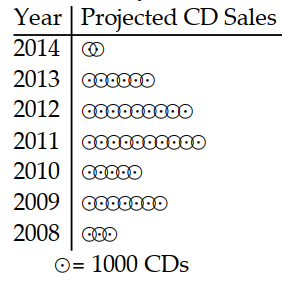 Between which two consecutive years is the greatest decline in sales indicated?
(Multiple Choice)
4.7/5 (46)
Construct the indicated stem-and-leaf.
-The normal monthly precipitation (in inches) for August is listed for 39 different U.S. cities.
3.5 1.6 2.4 3.7 4.1 3.9 1.0 3.6 1.7 0.4 3.2 4.2 4.1
4.2 3.4 3.7 2.2 1.5 4.2 3.4 2.7 4.0 2.0 0.8 3.6 3.7
0.4 3.7 2.0 3.6 3.8 1.2 4.0 3.1 0.5 3.9 0.1 3.5 3.4
(Multiple Choice)
4.7/5 (31)
For the set of numbers, find the mean, median, and any mode that exist.
-
(Multiple Choice)
4.9/5 (34)
A dart is thrown randomly and sticks on the circular dart board shown. Assume that all sectors are the same size and that the dart does not land on a border between shaded areas.
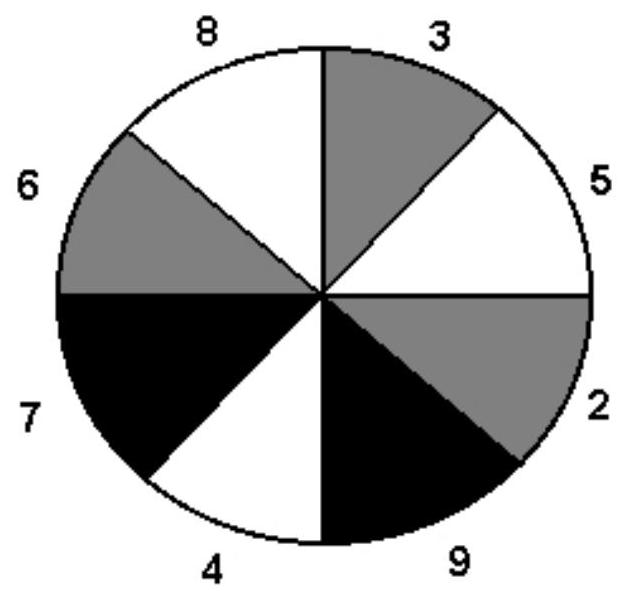 -Find the probability that the dart does not land on the sector numbered 3.
(Multiple Choice)
4.8/5 (40)
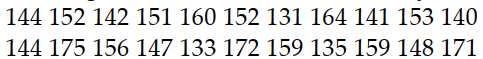
Construct the indicated stem-and-leaf.
-The weights of 22 members of the varsity football team are listed below.
(Multiple Choice)
4.7/5 (43)
Use the graph to answer the question.
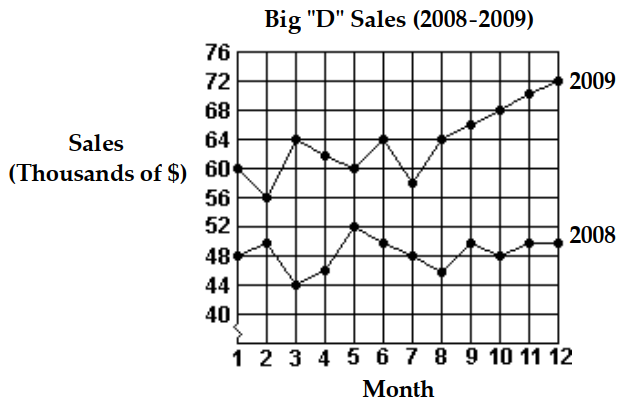 -What was the increase in sales between month 5 and month 6 of 2009?
(Multiple Choice)
5.0/5 (30)
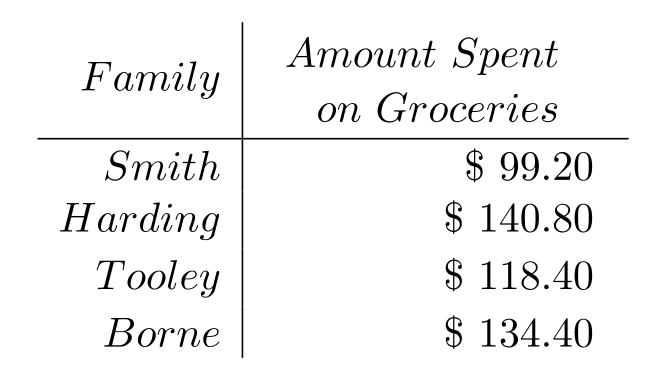
Construct a bar graph to represent the given data.
-The following table shows the average amount spent per week on groceries by four different families with three members.
(Essay)
4.7/5 (27)
A deck of cards contains 52 cards. These cards consist of four suits - hearts, spades, clubs, and diamonds. Each suit contains one of each of the following: , jack, queen, king, and ace. Assume that one card is selected at random from a well-shuffled deck of cards.
-Find the probability that the card is a red 8.
(Multiple Choice)
4.7/5 (29)
For the set of numbers, find the mean, median, and any mode that exist.
-
(Multiple Choice)
4.8/5 (36)
Solve the problem.
-Samuel consumed 2161 calories of food on Monday, 2337 calories on Tuesday, and 1820 calories on Wednesday. In order for Samuel's average calorie intake to equal a daily average of 2000 calories, how many calories of food must he consume on Thursday?
(Multiple Choice)
4.7/5 (38)
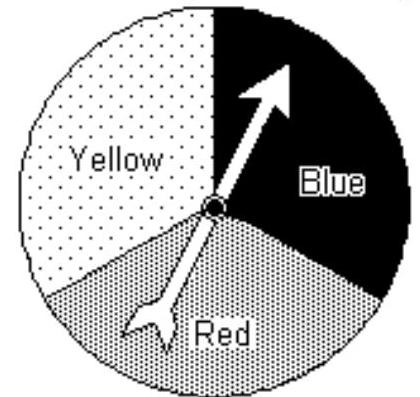
Solve the problem.
-Draw a tree diagram for the experiment of tossing a coin once then spinning the spinner once.
(Multiple Choice)
4.7/5 (31)
The following stem-and-leaf plot gives the heights of the 20 highest mountains in two continents. Use the plots to answer the question.
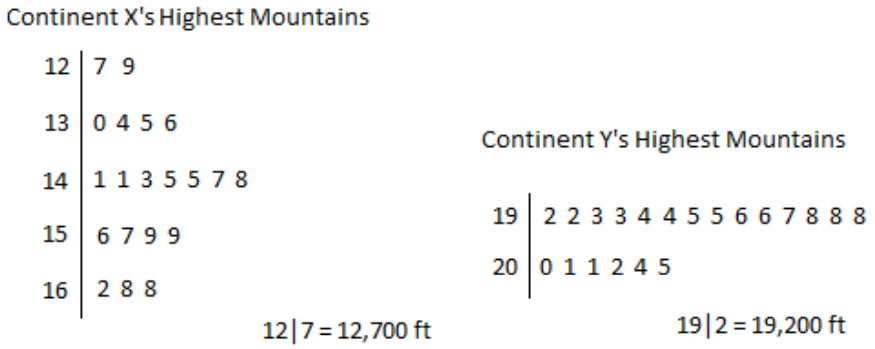 -Which of the two continents contains the highest mountain?
(Multiple Choice)
4.9/5 (41)
For the set of numbers, find the minimum, the maximum, and the range.
-
(Multiple Choice)
4.9/5 (32)
Use the circle graph to solve the problem.
-The circle graph below gives the inventory of the women's department of a store.
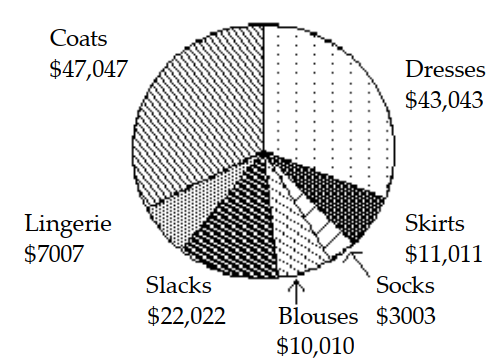 What is the total inventory?
(Multiple Choice)
4.9/5 (32)
Filters
- Essay(0)
- Multiple Choice(0)
- Short Answer(0)
- True False(0)
- Matching(0)