Exam 5: Data, Graphs, and Statistics
Exam 1: Whole Numbers394 Questions
Exam 2: Fraction Notation352 Questions
Exam 3: Decimal Notation457 Questions
Exam 4: Percent Notation436 Questions
Exam 5: Data, Graphs, and Statistics157 Questions
Exam 6: Geometry317 Questions
Exam 7: Introduction to Real Numbers and Algebraic Expressions354 Questions
Exam 8: Solving Equations and Inequalities272 Questions
Exam 9: Graphs of Linear Equations190 Questions
Exam 10: Polynomials: Operations389 Questions
Exam 11: Polynomials: Factoring192 Questions
Exam 12: Rational Expressions and Equations199 Questions
Exam 13: Systems of Equations79 Questions
Exam 14: Radical Expressions and Equations149 Questions
Exam 15: Quadratic Equations185 Questions
Exam 16: Converting Units of Measurement459 Questions
Select questions type
Use the pictograph to answer the question.
-For selected countries, this pictograph shows approximately how many kilograms of seafood are consumed by each person (per capita) annually.
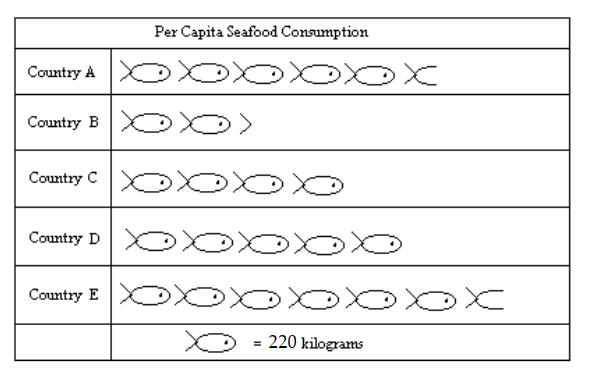 Approximately how many more kilograms of seafood is eaten per person in Country A than in Country B?
(Multiple Choice)
4.7/5  (33)
(33)
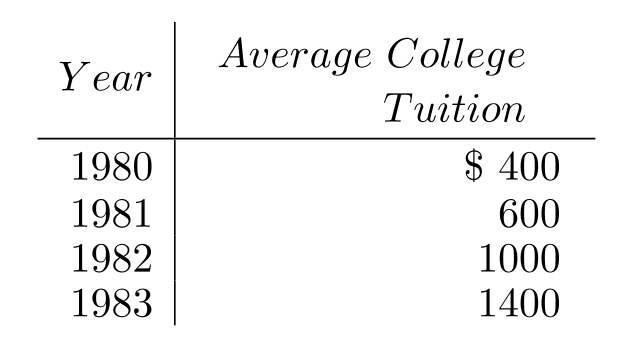
Make a line graph of the data in the table.
-The following table shows the average tuition for one semester at City X College over various years. Use time on the horizontal scale for your line graph.
(Essay)
4.8/5 (32)
Use the pictograph to answer the question.
-For selected countries, this pictograph shows approximately how many kilograms of seafood are consumed by each person (per capita) annually.
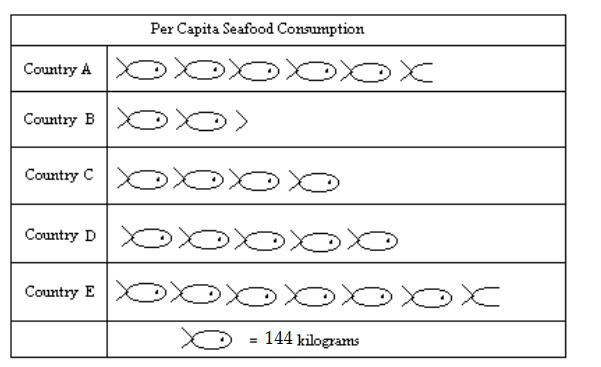 What is the approximate seafood consumption in Country E?
(Multiple Choice)
4.9/5 (29)
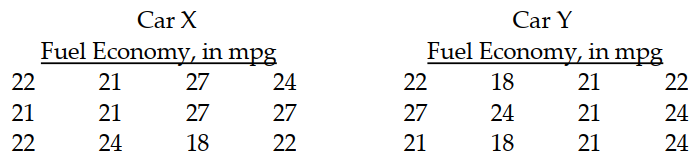
Solve the problem.
-An experiment is done to compare the average fuel economy of two models of cars. Several cars of each model were tested under similar conditions. The results are in the two tables below. Which car model is better?
(Multiple Choice)
4.8/5 (43)
Use the graph to answer the question.
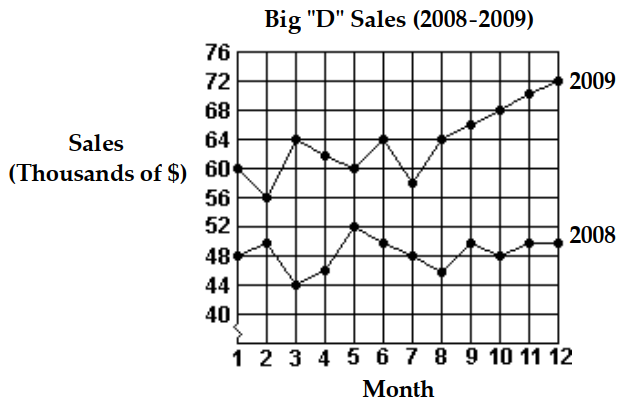 -Which month in 2009 had the highest sales?
(Multiple Choice)
4.9/5 (41)
The bar graph below shows the number of students by major in the College of Arts and Sciences. Answer the question.
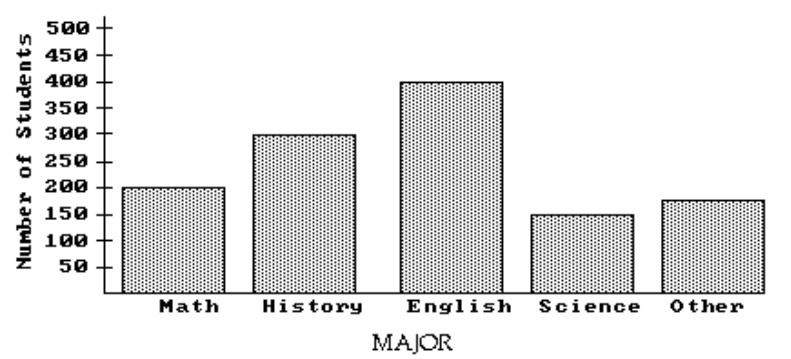 -Which major has the largest number of students?
(Multiple Choice)
4.9/5 (38)
Obtain the five-number summary for the given data.
-The test scores of 15 students are listed below.

(Multiple Choice)
4.9/5 (33)
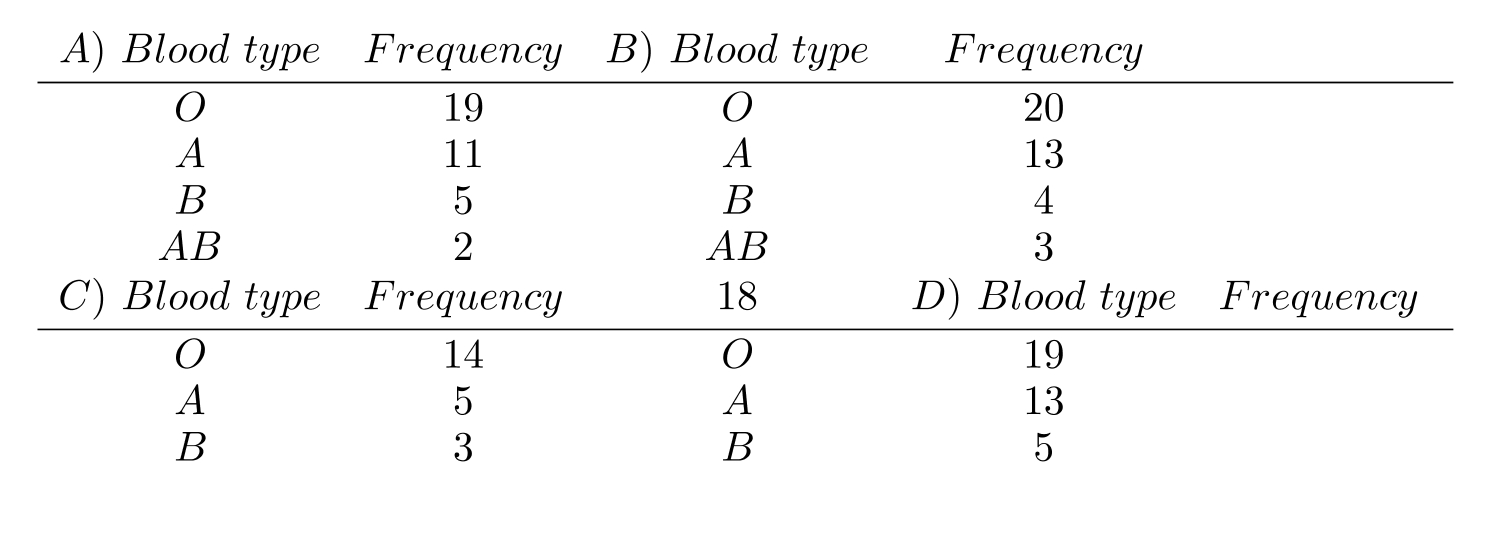
Construct a frequency distribution for the given qualitative data.
-The blood types for 40 people who agreed to participate in a medical study were as follows.
 A O A B O O O AB A A
A B O A A O O B O O
O A O O A B O O A AB
Construct a frequency distribution for the data.
A O A B O O O AB A A
A B O A A O O B O O
O A O O A B O O A AB
Construct a frequency distribution for the data.
(Short Answer)
4.9/5 (32)
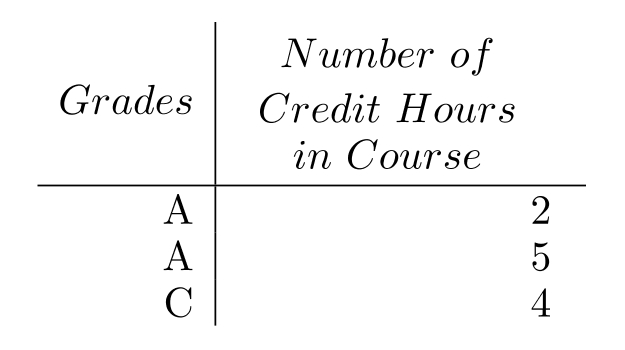
Given the grades of a student for one semester, find the grade point average. Assume that the grade point values are 4.0 for an for a , and so on. Round to the nearest tenth.
-
(Multiple Choice)
4.8/5 (41)
Find any modes that exist.
-104, 141, 156, 104, 188, 199, 162
(Multiple Choice)
4.9/5 (38)
Use the graph to answer the question.
-What was the total increase in sales for the first 6 months from 2008 to 2009?
(Multiple Choice)
4.9/5 (34)
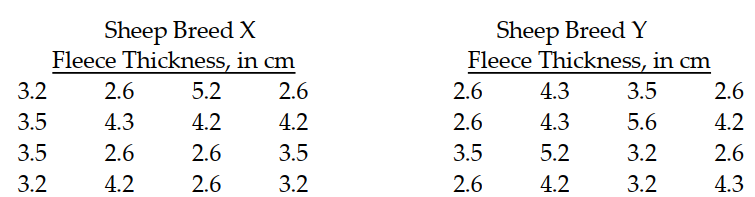
Solve the problem.
-Patty experiments to see which of two breeds of sheep produces thicker wool fleeces. She raises both under similar conditions and measures the fleece thickness, in centimeters, as follows. Which type of sheep produces better wool fleece?
(Multiple Choice)
4.9/5 (33)
Refer to the double-bar graph below which shows the number of male and female athletes at a university over a four-year period. Solve the problem.
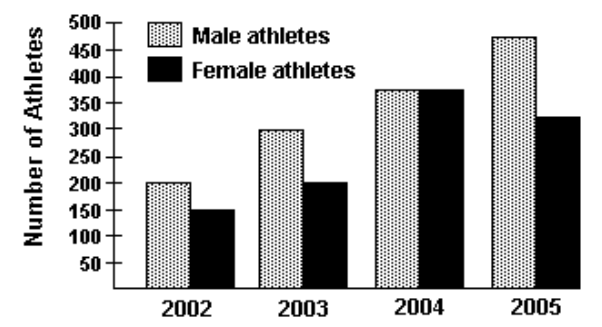 -Find the increase in the number of female athletes from 2003 to 2005.
(Multiple Choice)
4.9/5 (37)
The histogram shows the scores of each participant in a game from a total of 100 participants.
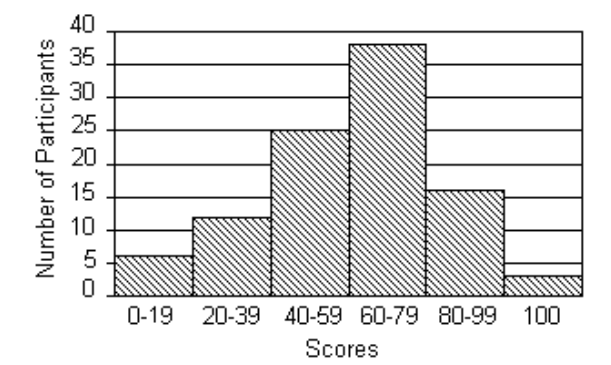 -How many participants scored more than 19 ?
(Multiple Choice)
4.8/5 (40)
The bar graph below shows the number of students by major in the College of Arts and Sciences. Answer the question.
-Which major has about 150 students?
(Multiple Choice)
4.8/5 (35)
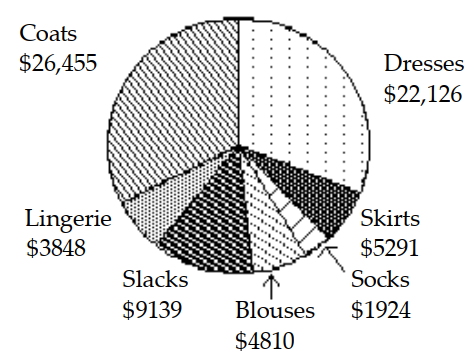
Use the circle graph to solve the problem.
-of apparel does the store have the smallest investment?
(Multiple Choice)
4.8/5 (33)
Solve the problem.
-Juan experiments to see which of two drugs helps keep lab mice from rejecting transplanted organs longer. He administers the drug to mice raised in similar conditions and measures the time, in weeks, as follows. Which drug is better?
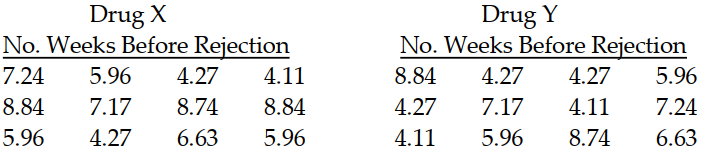
(Multiple Choice)
4.8/5 (33)
Use the two-way frequency table to solve the problem.
-A medium-sized company characterized their employees based on the sex of the employee and their length of service to the company. The results are summarized in the table below.
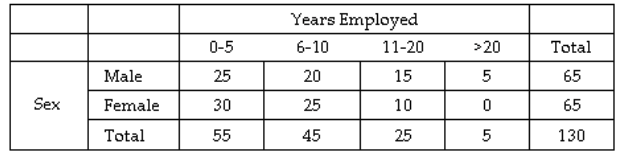 What percentage of the men have worked for the company for more than 10 years?
(Multiple Choice)
4.9/5 (36)
A deck of cards contains 52 cards. These cards consist of four suits - hearts, spades, clubs, and diamonds. Each suit contains one of each of the following: , jack, queen, king, and ace. Assume that one card is selected at random from a well-shuffled deck of cards.
-Find the probability that the card is a diamond.
(Multiple Choice)
4.9/5 (31)
Use the pictograph to answer the question.
-This pictograph shows projected sales of compact disks (CDs) for a popular rock band for seven consecutive years.
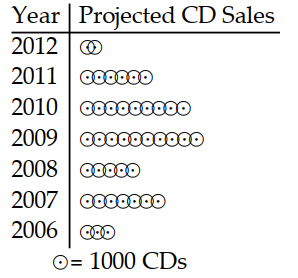 Approximately how many fewer CDs will be sold in 2008 than in 2010?
(Multiple Choice)
4.9/5 (34)
Filters
- Essay(0)
- Multiple Choice(0)
- Short Answer(0)
- True False(0)
- Matching(0)