Exam 5: Data, Graphs, and Statistics
Exam 1: Whole Numbers394 Questions
Exam 2: Fraction Notation352 Questions
Exam 3: Decimal Notation457 Questions
Exam 4: Percent Notation436 Questions
Exam 5: Data, Graphs, and Statistics157 Questions
Exam 6: Geometry317 Questions
Exam 7: Introduction to Real Numbers and Algebraic Expressions354 Questions
Exam 8: Solving Equations and Inequalities272 Questions
Exam 9: Graphs of Linear Equations190 Questions
Exam 10: Polynomials: Operations389 Questions
Exam 11: Polynomials: Factoring192 Questions
Exam 12: Rational Expressions and Equations199 Questions
Exam 13: Systems of Equations79 Questions
Exam 14: Radical Expressions and Equations149 Questions
Exam 15: Quadratic Equations185 Questions
Exam 16: Converting Units of Measurement459 Questions
Select questions type
The bar graph below shows the number of students by major in the College of Arts and Sciences. Answer the question.
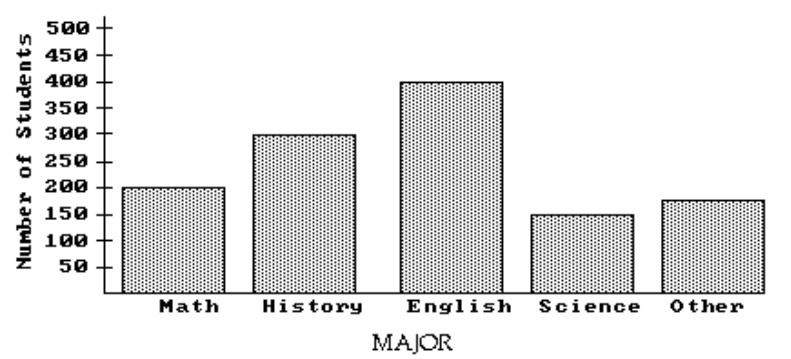 -What is the average number of students taking Science, English, and Math? Round your answer to the nearest whole student if necessary.
(Multiple Choice)
4.9/5  (31)
(31)
Refer to the double-bar graph below which shows the number of male and female athletes at a university over a four-year period. Solve the problem.
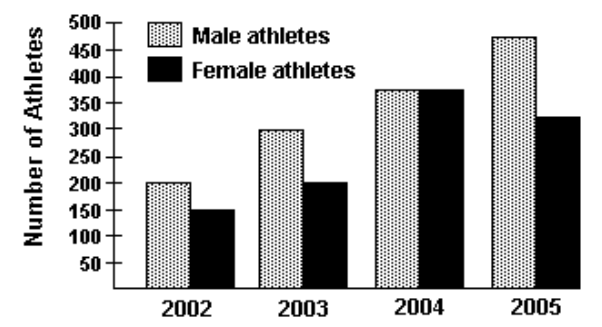 -Which year had the greatest number of female athletes? What was the total number of male athletes that year?
(Multiple Choice)
4.8/5 (35)
The histogram shows the scores of each participant in a game from a total of 100 participants.
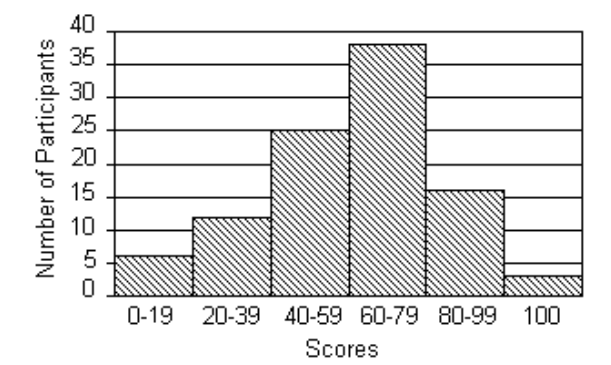 -How many participants scored 100 ?
(Multiple Choice)
4.7/5 (41)
Use the circle graph to solve the problem.
-A survey of the 3356 vehicles on the campus of State University yielded the following circle graph.
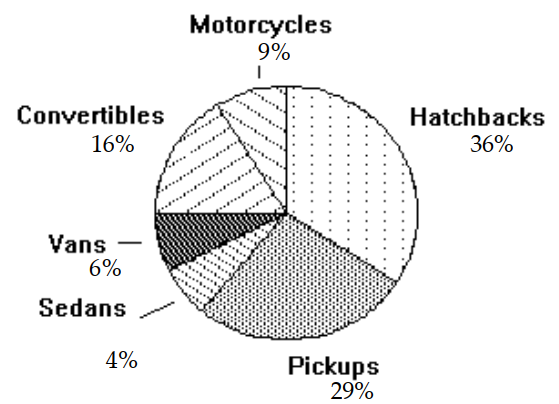 Together, what percent of the vehicles are either vans or convertibles?
(Multiple Choice)
4.8/5 (41)
The following table contains information about moons orbiting a planet named Geo I. Use the table to solve the problem.
-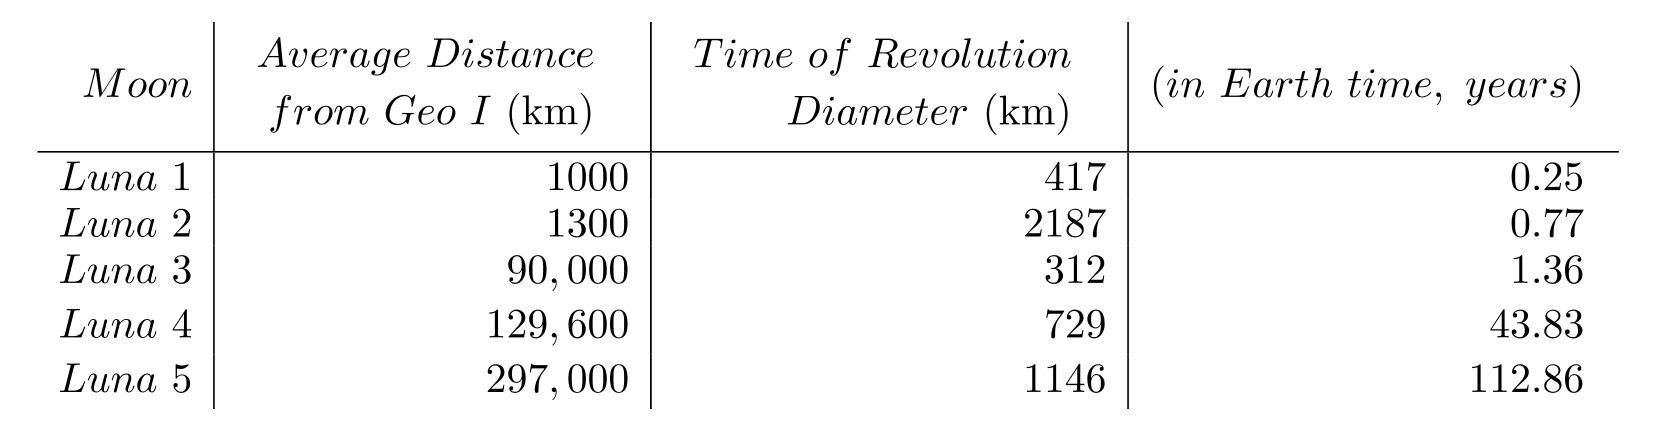 Which moons have average distance from Geo I less than ten thousand kilometers?
(Multiple Choice)
4.9/5 (42)
Use the graph to answer the question.
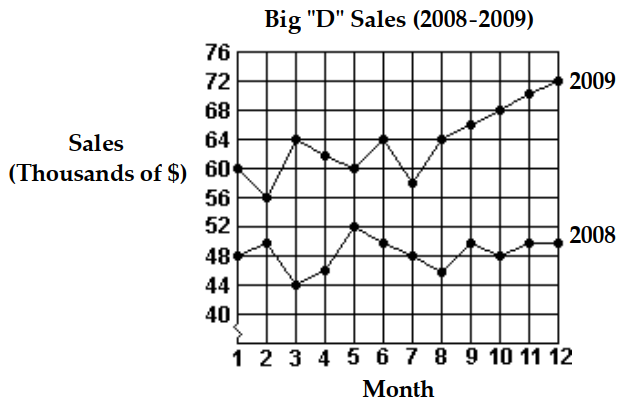 -What were the total sales for 2008?
(Multiple Choice)
4.7/5 (33)
Use the circle graph to solve the problem.
-The circle graph below gives the number of students in the residence halls at the state university.
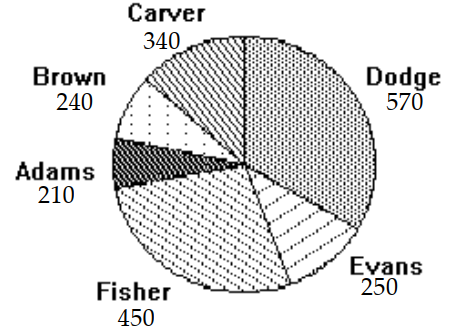 Which residence hall has the third highest number of students?
(Multiple Choice)
4.8/5 (34)
The bar graph below shows the number of students by major in the College of Arts and Sciences. Answer the question.
-The English department assigns a counselor to each student majoring in English. Each counselor is assigned 20 students. How many counselors are needed?
(Multiple Choice)
4.9/5 (35)
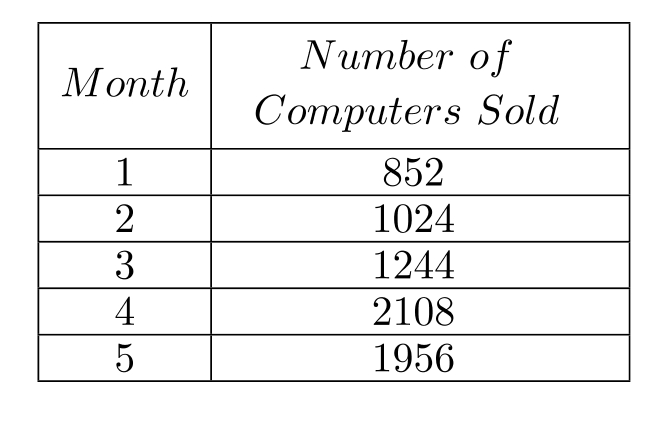
Make a line graph of the data in the table.
-The following table shows the number of computer sales made at Computer Buy over five months. Use time on the horizontal scale for your line graph.
(Essay)
4.8/5 (38)
The following stem-and-leaf plot gives the heights of the 20 highest mountains in two continents. Use the plots to answer the question.
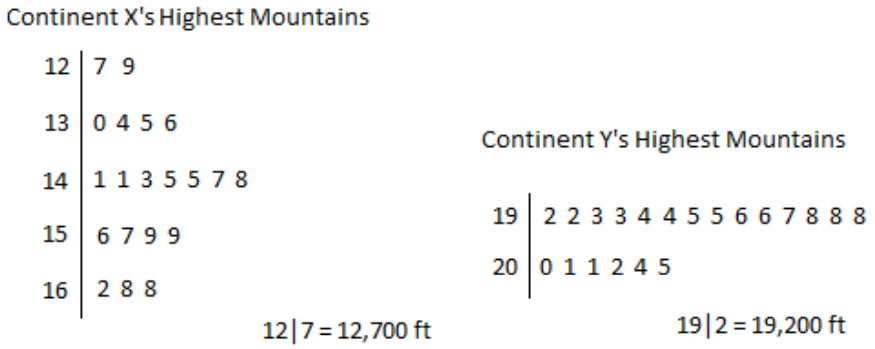 -For which of the two continents is there a smaller range of heights in its 20 highest mountains?
(Multiple Choice)
4.9/5 (39)
Use the graph to answer the question.
-What was the total increase in sales from 2008 to 2009?
(Multiple Choice)
4.8/5 (45)
The bar graph below shows the number of students by major in the College of Arts and Sciences. Answer the question.
-What is the median number of students taking History, Science, and Math?
(Multiple Choice)
4.8/5 (30)
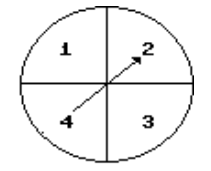
Draw a tree diagram for the experiment. Then use the diagram to find the number of possible outcomes.
-Spin the spinner once and toss a coin.
(Multiple Choice)
4.9/5 (38)
A deck of cards contains 52 cards. These cards consist of four suits - hearts, spades, clubs, and diamonds. Each suit contains one of each of the following: , jack, queen, king, and ace. Assume that one card is selected at random from a well-shuffled deck of cards.
-Find the probability that the card is a queen
(Multiple Choice)
4.8/5 (35)
Determine the quartiles as specified.
-The normal annual precipitation (in inches) is given below for 21 different U.S. cities. Find the first quartile.

(Multiple Choice)
4.7/5 (37)
Filters
- Essay(0)
- Multiple Choice(0)
- Short Answer(0)
- True False(0)
- Matching(0)