Exam 4: Relationships Between Categorical Variables
Exam 1: Statistics Success Stories and Cautionary Tales79 Questions
Exam 2: Turning Data Into Information94 Questions
Exam 3: Relationships Between Quantitative Variables99 Questions
Exam 4: Relationships Between Categorical Variables100 Questions
Exam 5: Sampling: Surveys and How to Ask Questions109 Questions
Exam 6: Gathering Useful Data for Examining Relationships90 Questions
Exam 7: Probability112 Questions
Exam 8: Random Variables115 Questions
Exam 9: Understanding Sampling Distributions: Statistics As Random Variables231 Questions
Exam 10: Estimating Proportions With Confidence104 Questions
Exam 11: Estimating Means With Confidence103 Questions
Exam 12: Testing Hypotheses About Proportions139 Questions
Exam 13: Testing Hypotheses About Means166 Questions
Exam 14: Inference About Simple Regression115 Questions
Exam 15: More About Inference for Categorical Variables111 Questions
Exam 16: Analysis of Variance111 Questions
Exam 17: Turning Information Into Wisdom70 Questions
Select questions type
Use the following information for questions:
In the General Social Survey, respondents were asked "Would you approve of an adult male punching a stranger if the stranger was drunk and bumped into the man and his wife on the street?" A two-way table summarizing the results for 1006 respondents, by gender, is shown below: 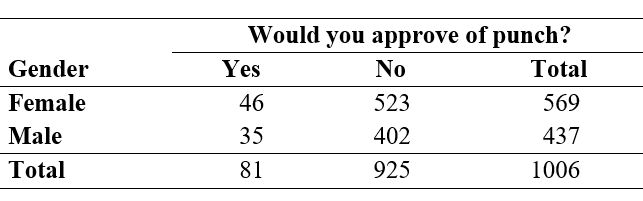 Chi-Square = 0.002, DF = 2, P-Value = 0.9990
-Based on the chi-square statistic and p-value, what conclusion can be made about the relationship between gender and response to the question about approving of a punch, using = 0.05?
Chi-Square = 0.002, DF = 2, P-Value = 0.9990
-Based on the chi-square statistic and p-value, what conclusion can be made about the relationship between gender and response to the question about approving of a punch, using = 0.05?
(Multiple Choice)
4.8/5  (40)
(40)
Use the following information for questions:
In the General Social Survey, respondents were asked "Would you approve of an adult male punching a stranger if the stranger was drunk and bumped into the man and his wife on the street?" A two-way table summarizing the results for 1006 respondents, by gender, is shown below: Chi-Square = 0.002, DF = 2, P-Value = 0.9990
-The percentage of males who responded 'Yes' was
(Multiple Choice)
4.8/5 (24)
Use the following information for questions:
The table below summarizes, by gender of respondent, the responses from 1,033 people to the question, "Do you smoke?" 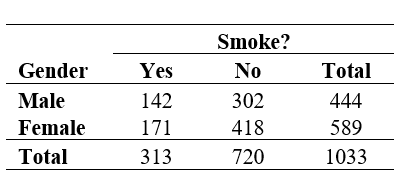 -Based on the National Household Survey on Drug Abuse, the percentage of 17-year olds who ever tried cigarette smoking is 56.2%. The relative risk of ever smoking for a 17-year old versus a 12-year old is 3.6. What is the risk of smoking for a 12-year-old (i.e. what was the percentage of 12-year olds who ever tried smoking)?
(Multiple Choice)
5.0/5 (38)
The tables below show the financial aid results by gender for each program.
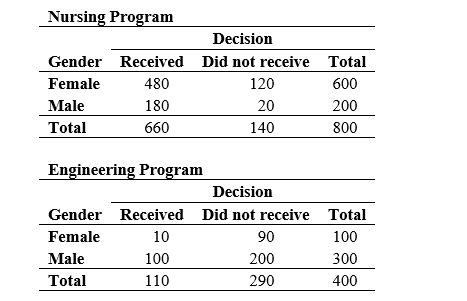 -For the nursing program, what are the percentages of females and of males that received some sort of financial aid?
(Short Answer)
4.8/5 (26)
Use the following information for questions:
The table below shows the opinions of 908 respondents in the General Social Survey to the question "Do you believe there is life after death?"Life After Death? 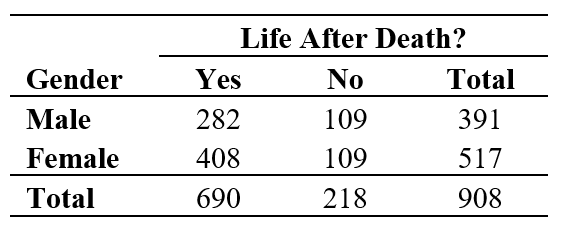 -What are the odds of believing in life after death for males?
(Short Answer)
4.9/5 (34)
A statement that claims that changes in the explanatory variable will have no effect on the response variable is an example of a(n) _____________ hypothesis.
(Multiple Choice)
4.8/5 (31)
Use the following information for questions:
The table below shows the counts by gender and highest degree attained for 498 respondents in the General Social Survey.
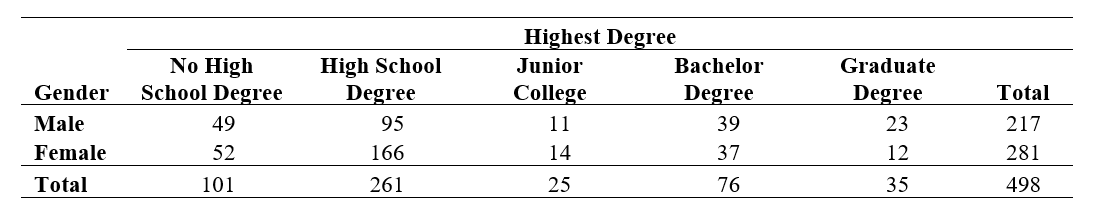 -What percent of the sample did not graduate from high school?
(Multiple Choice)
4.7/5 (33)
Use the following information for questions:
The table below shows the opinions of 1447 respondents in the General Social Survey to the question "Do you favor or oppose the death penalty for persons convicted of murder?" The purpose of examining the data is to see if there is a gender difference in how people would respond to this question. 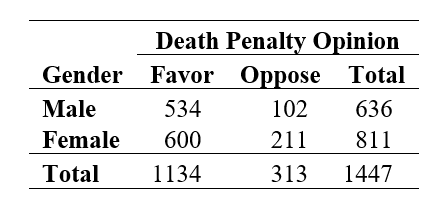 -State the null and alternative hypotheses for this study.
(Short Answer)
4.7/5 (40)
Use the following information for questions:
A researcher conducted a study on college students to see if there was a link between gender and how often they have cheated on an exam. She asked two questions on a survey:
(1) What is your gender? Male ___ Female ___
(2) How many times have you cheated on an exam while in college?
Never __ 1 or 2 times ___ 3 or more times ___
A two-way table of observed counts follows:
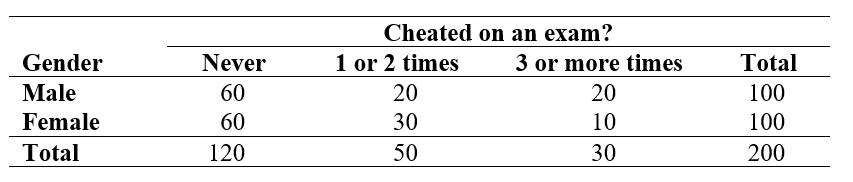 Chi-Square = 5.33, DF = 2, P-Value = 0.0696
-The percentage of females who cheated 1 or 2 times was
Chi-Square = 5.33, DF = 2, P-Value = 0.0696
-The percentage of females who cheated 1 or 2 times was
(Multiple Choice)
4.9/5 (30)
The tables below show the financial aid results by gender for each program.
-Explain how each program can have a higher percentage of males receiving financial aid, yet overall there was a higher percentage of females receiving financial aid. Think about the differences between these two programs in terms of financial aid being given, and the distribution of gender for each program.
(Essay)
4.7/5 (36)
Use the following information for questions:
A researcher conducted a study on college students to see if there was a link between gender and how often they have cheated on an exam. She asked two questions on a survey:
(1) What is your gender? Male ___ Female ___
(2) How many times have you cheated on an exam while in college?
Never __ 1 or 2 times ___ 3 or more times ___
A two-way table of observed counts follows:
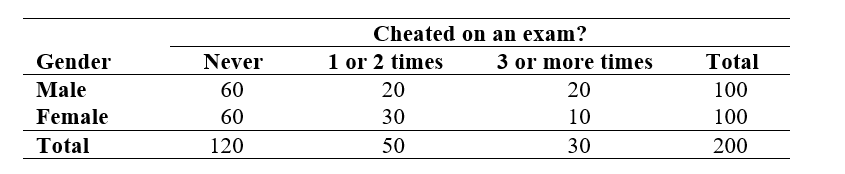 -What percent of the males in the study cheated 3 or more times on an exam?
(Multiple Choice)
4.9/5 (44)
Use the following information for questions:
The table below summarizes, by gender of respondent, the responses from 1,033 people to the question, "Do you smoke?"
-What is the odds ratio for men smoking (to not smoking) compared to women?
(Multiple Choice)
4.8/5 (35)
Use the following information for questions:
A study done by the Center for Academic Integrity at Rutgers University surveyed 2116 students at 21 colleges and universities. Some of the schools had an "honor code"and others did not. Of the students at schools with an honor code, 7% reported having plagiarized a paper via the Internet, while at schools with no honor code, 13% did so. (Sacramento Bee, Feb 29, 2000, D1.)
-Which of the following statements about percent increase in risk is correct for this study?
(Multiple Choice)
4.9/5 (39)
Use the following information for questions:
The table shows the opinions of 1027 respondents in the General Social Survey to the question "Is there any area right around here - that is, within a mile - where you would be afraid to walk alone at night?" The purpose of examining the data is to see if there is a gender difference in how people would respond to this question. 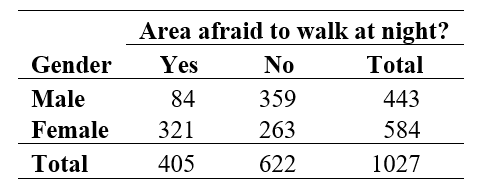 -If the null hypothesis is true, calculate the expected number of men in the sample who would be afraid to walk alone in their neighborhood at night.
(Short Answer)
4.8/5 (38)
Use the following information for questions:
The table shows the opinions of 953 respondents in the General Social Survey to the question "If your party nominated a woman for President, would you vote for her if she were qualified for the job?" 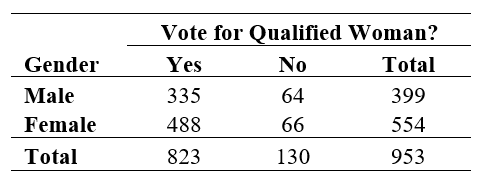 -What percent of females would vote for a woman president?
(Short Answer)
4.8/5 (41)
Use the following information for questions:
The table below shows the responses from a sample of 680 people in the General Social Survey to the question, "Do you sometimes drink more than you think you should?" 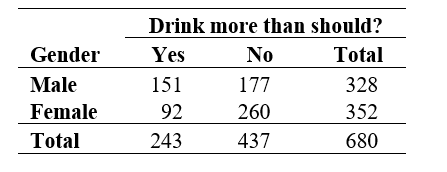 -What is the risk (or percentage) of men thinking they drank more than they should?
(Multiple Choice)
4.7/5 (41)
Use the following information for questions:
A researcher conducted a study on college students to see if there was a link between gender and how often they have cheated on an exam. She asked two questions on a survey:
(1) What is your gender? Male ___ Female ___
(2) How many times have you cheated on an exam while in college?
Never __ 1 or 2 times ___ 3 or more times ___
A two-way table of observed counts follows:
-What percent of the females in the study cheated 3 or more times on an exam?
(Multiple Choice)
4.8/5 (31)
Use the following information for questions:
The table below shows the ratings given by 200 students in an introductory statistics course. There were two instructors for the course, each with 100 students. 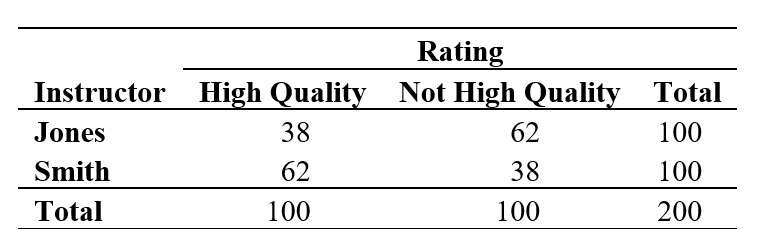 -Among those students who consider themselves good at math, which instructor has the highest percentage of high quality teaching ratings?
(Multiple Choice)
4.9/5 (39)
Use the following information for questions:
The table below shows the ratings given by 200 students in an introductory statistics course. There were two instructors for the course, each with 100 students.
-What percent of Smith's students rated the teaching as high quality?
(Multiple Choice)
4.8/5 (34)
Use the following information for questions:
The table shows the opinions of 1027 respondents in the General Social Survey to the question "Is there any area right around here - that is, within a mile - where you would be afraid to walk alone at night?" The purpose of examining the data is to see if there is a gender difference in how people would respond to this question.
-To test whether there is a relationship in the population between gender and fear of walking alone at night, the chi-square statistic = 136.7 and the p-value < 0.001. Are the results statistically significant or not statistically significant? State your conclusion.
(Short Answer)
4.9/5 (34)
Filters
- Essay(0)
- Multiple Choice(0)
- Short Answer(0)
- True False(0)
- Matching(0)