Exam 4: Relationships Between Categorical Variables
Exam 1: Statistics Success Stories and Cautionary Tales79 Questions
Exam 2: Turning Data Into Information94 Questions
Exam 3: Relationships Between Quantitative Variables99 Questions
Exam 4: Relationships Between Categorical Variables100 Questions
Exam 5: Sampling: Surveys and How to Ask Questions109 Questions
Exam 6: Gathering Useful Data for Examining Relationships90 Questions
Exam 7: Probability112 Questions
Exam 8: Random Variables115 Questions
Exam 9: Understanding Sampling Distributions: Statistics As Random Variables231 Questions
Exam 10: Estimating Proportions With Confidence104 Questions
Exam 11: Estimating Means With Confidence103 Questions
Exam 12: Testing Hypotheses About Proportions139 Questions
Exam 13: Testing Hypotheses About Means166 Questions
Exam 14: Inference About Simple Regression115 Questions
Exam 15: More About Inference for Categorical Variables111 Questions
Exam 16: Analysis of Variance111 Questions
Exam 17: Turning Information Into Wisdom70 Questions
Select questions type
The relative risk of a disease for group 1 compared to group 2 is close to the odds ratio under which of these circumstances?
(Multiple Choice)
4.8/5  (38)
(38)
Explain in your own words or through an example what Simpson's paradox is.
(Essay)
4.8/5 (33)
Pick the choice that best completes the following sentence. If a relationship between two variables is called statistically significant, it means the investigators think the variables are
(Multiple Choice)
4.7/5 (37)
A study on the use of seat belts versus belted booster seats for children ages 4 and 5 reported that "Using seat belts instead of booster seats was associated with increased risk for serious injury in an accident; the relative risk was 2.4."Based on this, it can be concluded that for this study:
(Multiple Choice)
5.0/5 (40)
The statistical significance of the association or relationship between two categorical variables is examined using a value known as the chi-square statistic, and a corresponding p-value that assesses the chance of getting this value for the Chi-square statistic or one even larger. Suppose the p-value of the test turns out to be 0.18. In this case, we should decide that
(Multiple Choice)
4.9/5 (30)
Use the following information for questions:
The table shows the opinions of 1027 respondents in the General Social Survey to the question "Is there any area right around here - that is, within a mile - where you would be afraid to walk alone at night?" The purpose of examining the data is to see if there is a gender difference in how people would respond to this question. 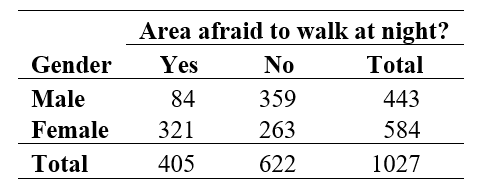 -State the null and alternative hypotheses for this study.
(Short Answer)
4.8/5 (36)
Use the following information for questions:
Students in a statistics class were asked, "With whom do you find it easier to make friends: person of the same sex, person of opposite sex, or no preference?" A table summarizing the responses by gender is given below. Minitab results for a chi-square test for these data were "Chi-Sq = 7.15 DF=2 P-value = 0.028." 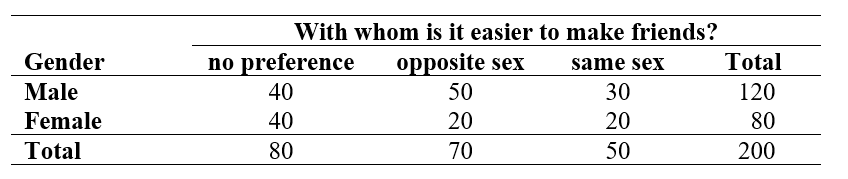 -Among females, what percent said "same sex?"
(Multiple Choice)
4.7/5 (31)
Use the following information for questions:
The table below summarizes, by gender of respondent, the responses from 1,033 people to the question, "Do you smoke?" 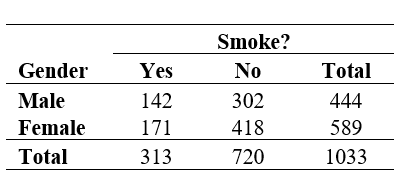 -What is the odds ratio for women smoking (to not smoking) compared to men?
(Multiple Choice)
4.8/5 (26)
The relative risk of allergies for children of parents who smoke compared to children of parents who don't smoke is 3.0. Suppose that the risk of allergies for the children of non-smokers is 0.15 (15%). What is the risk of allergies for the children of smokers?
(Multiple Choice)
4.8/5 (38)
A 1995 Washington Post-ABC News Poll on Affirmative Action reported that 76 percent of men and 69 percent of women opposed giving preferences to women in hiring, promotions and college admissions. What are the odds that a woman was opposed to giving preferences versus not opposed?
(Short Answer)
4.8/5 (34)
Use the following information for questions:
The table below shows the opinions of 321 respondents from the General Social Survey by whether they owned a gun (or not) and whether they favored (or opposed) a law requiring a permit to own a gun. 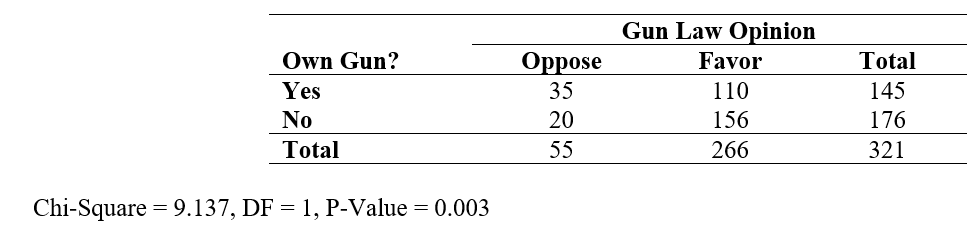 -Based on the chi-square statistic and p-value, one can conclude that
(Multiple Choice)
4.7/5 (34)
A statistically significant relationship between two categorical variables is illustrated in the sample as one that
(Multiple Choice)
4.8/5 (33)
Use the following information for questions:
A researcher conducted a study on college students to see if there was a link between gender and how often they have cheated on an exam. She asked two questions on a survey:
(1) What is your gender? Male ___ Female ___
(2) How many times have you cheated on an exam while in college?
Never __ 1 or 2 times ___ 3 or more times ___
A two-way table of observed counts follows:
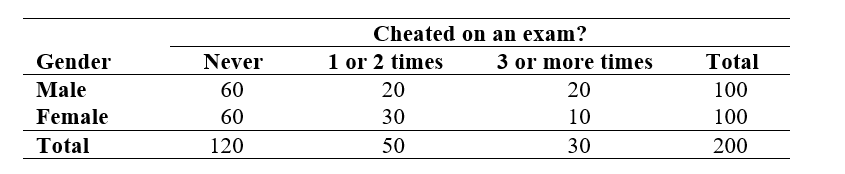 -What percent of the students in the study cheated 3 or more times on an exam?
(Multiple Choice)
4.7/5 (33)
Use the following information for questions:
The table below shows the ratings given by 200 students in an introductory statistics course. There were two instructors for the course, each with 100 students. 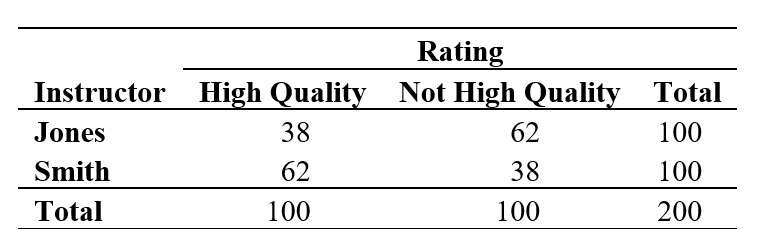 -What percent of Jones' students rated the teaching as high quality?
(Multiple Choice)
4.8/5 (38)
Use the following information for questions:
The table below shows the counts by gender and highest degree attained for 498 respondents in the General Social Survey.
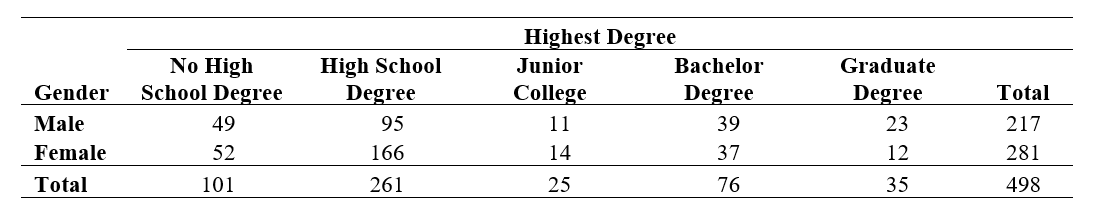 -What percent of the sample were males?
(Multiple Choice)
4.7/5 (38)
A study done by the Center for Academic Integrity at Rutgers University surveyed 2116 students at 21 colleges and universities. Some of the schools had an "honor code"and others did not. Of the students at schools with an honor code, 7% reported having plagiarized a paper via the Internet, while at schools with no honor code, 13% did so. (Sacramento Bee, Feb 29, 2000, D1.) Although the data provided are not sufficient to carry out a chi-square test of the relationship between whether or not a school has an honor code and whether or not a student would plagiarize a paper via the Internet, suppose such a test were to show a statistically significant relationship on the basis of this study. What would be the correct conclusion?
(Multiple Choice)
5.0/5 (29)
Use the following information for questions:
The table below shows the opinions of 908 respondents in the General Social Survey to the question "Do you believe there is life after death?" 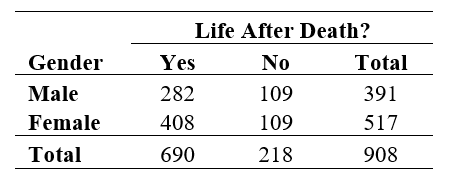 -What percent of males believe in life after death?
(Short Answer)
4.8/5 (31)
Use the following information for questions:
The table below shows the responses from a sample of 680 people in the General Social Survey to the question, "Do you sometimes drink more than you think you should?" 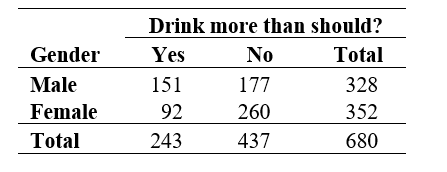 -What is the odds ratio for women thinking they drank more than they should compared to men?
(Multiple Choice)
4.9/5 (29)
Use the following information for questions:
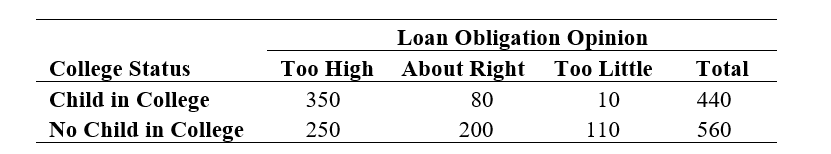
In a survey of 1000 adults, respondents were asked about the expense of a college education and the relative necessity of financial assistance. The correspondents were classified as to whether they currently had a child in college or not (college status), and whether they thought the loan obligation for most college students was too high, about right, or too little (loan obligation opinion). The table below summarizes some of the survey results. Use these results to answer the following questions.
 -The table below shows the row percentages
 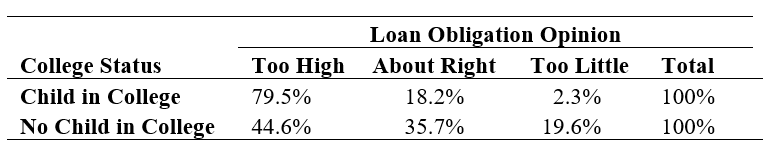 Based on these percentages, describe the relationship between loan obligation opinion and college status.
(Essay)
4.9/5 (35)
Filters
- Essay(0)
- Multiple Choice(0)
- Short Answer(0)
- True False(0)
- Matching(0)